Northwest Independent School District, Texas
| Northwest Independent School District |
|---|
| Justin, Texas |
| District details |
| Superintendent: Ryder Warren |
| # of school board members: 7 |
| Website: Link |
Northwest Independent School District is a school district in Texas that serves parts of Denton County, Tarrant County and Wise County. The district was the 63rd-largest school district in the state in the 2014-2015 school year and served 19,831 students.[1] It had an operating budget of $246 million during the 2012-2013 school year.[2]
About the district
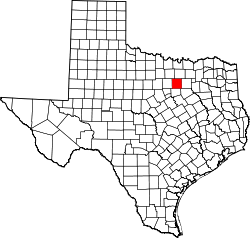
The Northwest Independent School District is located in Tarrant County in northeastern Texas. The county seat is Fort Worth. Tarrant County was home to an estimated 1,982,498 residents in 2015, according to the United States Census Bureau.[3]
Demographics
Tarrant County outperformed Texas as a whole in terms of higher education achievement between 2011 and 2015. The United States Census Bureau found that 30.3 percent of county residents aged 25 years and older had attained a bachelor's degree, compared to 27.6 percent of state residents. The median household income in Tarrant County during that time period was $58,711, compared to $53,207 statewide. The poverty rate in the county was 13.1 percent, compared to 15.9 percent for the entire state.[3]
| Racial Demographics, 2011-2015[3] | ||
|---|---|---|
| Race | Tarrant County (%) | Texas (%) |
| White | 74.7 | 79.7 |
| Black or African American | 16.4 | 12.5 |
| American Indian and Alaska Native | 0.9 | 1.0 |
| Asian | 5.4 | 4.7 |
| Native Hawaiian and Other Pacific Islander | 0.2 | 0.1 |
| Two or More Races | 2.3 | 1.9 |
| Hispanic or Latino | 28.2 | 38.8 |
Note: Percentages for race and ethnicity may add up to more than 100 percent because respondents may report more than one race and the Hispanic/Latino ethnicity may be selected in conjunction with any race. Read more about race and ethnicity in the census here.
Superintendent
| |
This information is updated as we become aware of changes. Please contact us with any updates. |
Ryder Warren is the superintendent of the Northwest Independent School District. Warren was appointed superintendent in July 2016. Warren's previous career experience includes working as the superintendent of the Midland Independent School District, Marble Falls Independent School District, Crane Independent School District, and Thorndale Independent School District.[4][5]
Past superintendents
- Karen G. Rue was the superintendent of the Northwest Independent School District from 2005 to 2016. Rue's previous career experience included working as the superintendent of the Tuloso-Midway Independent School District.[6]
School board elections
The Northwest ISD board of trustees consists of seven members who are elected by district to three-year terms.[7]
| Northwest ISD board of trustees | ||
|---|---|---|
| Member | Place # | Term Ends |
| DeAnne Hatfield | Place 1 | 2021 |
| Mark Schluter | Place 2 | 2021 |
| Anne Davis-Simpson | Place 3 | 2022 |
| Judy Copp | Place 4 | 2022 |
| Steve Sprowls | Place 5 | 2020 |
| Lillian Rauch | Place 6 | 2020 |
| Ron Hastings | Place 7 | 2020 |
| |
This officeholder information was last updated on November 4, 2019. Please contact us with any updates. | |
Election dates
- See also: 2014 elections, 2015 elections, 2016 elections, 2017 elections, 2018 elections, and 2019 elections
Members of the Northwest ISD board of trustees are elected by district to three-year terms. Elections are held on a staggered basis every year in May. Three seats were up for election in 2017, and three seats were up for election in 2018. Three seats were up for election in 2019.
Public participation in board meetings
The Northwest ISD board of trustees maintains the following policy regarding public participation in board meetings:
| “ |
As long as the requirements of the Open Meetings Act are satisfied and the right of citizens to apply to the Board for redress of their grievances is not abridged, the Board need not provide a public forum for every citizen wishing to express an opinion on a matter. Reasonable restraints on the number, length, and frequency of presentations are permissible. The Board may limit the number of persons it will hear on a particular subject and the frequency with which they may appear, so long as the regulation does not abridge constitutionally guaranteed rights of freedom of speech and to petition nor unfairly discriminate among views seeking expression.[8] |
” |
| —Northwest ISD board of trustees (2011)[9] | ||
Budget
From 1993 to 2013, the Northwest Independent School District had an average of $101,085,286 in revenue and $122,472,143 in expenditures, according to the United States Census Bureau's survey of school system finances. The district had a yearly average of $234,102,333 in outstanding debt. The district retired $13,834,667 of its debt and issued $41,497,476 in new debt each year on average.[10]
Revenue
The table below separates the district's revenue into the three sources identified by the agency: local, state, and federal.
| Revenue by Source | |||||||||||
|---|---|---|---|---|---|---|---|---|---|---|---|
| Fiscal Year |
Local | State | Federal | Revenue Total | |||||||
| Total | % of Revenue | Total | % of Revenue | Total | % of Revenue | ||||||
| Click [show] on the right to display the revenue data for prior years. | |||||||||||
|---|---|---|---|---|---|---|---|---|---|---|---|
| 1993 | $11,089,000 | 52.33% | $9,515,000 | 44.90% | $588,000 | 2.77% | $21,192,000 | ||||
| 1994 | $11,872,000 | 58.89% | $7,506,000 | 37.24% | $780,000 | 3.87% | $20,158,000 | ||||
| 1995 | $15,178,000 | 61.67% | $8,467,000 | 34.40% | $967,000 | 3.93% | $24,612,000 | ||||
| 1996 | $16,864,000 | 64.90% | $8,213,000 | 31.61% | $909,000 | 3.50% | $25,986,000 | ||||
| 1997 | $21,485,000 | 72.09% | $7,298,000 | 24.49% | $1,018,000 | 3.42% | $29,801,000 | ||||
| 1998 | $24,904,000 | 76.58% | $6,593,000 | 20.27% | $1,023,000 | 3.15% | $32,520,000 | ||||
| 1999 | $31,582,000 | 78.62% | $7,282,000 | 18.13% | $1,308,000 | 3.26% | $40,172,000 | ||||
| 2000 | $42,601,000 | 87.38% | $4,407,000 | 9.04% | $1,744,000 | 3.58% | $48,752,000 | ||||
| 2001 | $48,406,000 | 88.67% | $4,379,000 | 8.02% | $1,807,000 | 3.31% | $54,592,000 | ||||
| 2002 | $61,873,000 | 92.24% | $3,468,000 | 5.17% | $1,734,000 | 2.59% | $67,075,000 | ||||
| 2003 | $72,950,000 | 90.64% | $5,655,000 | 7.03% | $1,878,000 | 2.33% | $80,483,000 | ||||
| 2004 | $83,243,000 | 91.35% | $5,499,000 | 6.03% | $2,385,000 | 2.62% | $91,127,000 | ||||
| 2005 | $105,187,000 | 91.51% | $6,906,000 | 6.01% | $2,853,000 | 2.48% | $114,946,000 | ||||
| 2006 | $121,342,000 | 91.26% | $7,935,000 | 5.97% | $3,680,000 | 2.77% | $132,957,000 | ||||
| 2007 | $145,224,000 | 87.71% | $16,482,000 | 9.95% | $3,860,000 | 2.33% | $165,566,000 | ||||
| 2008 | $131,035,000 | 75.80% | $38,376,000 | 22.20% | $3,461,000 | 2.00% | $172,872,000 | ||||
| 2009 | $148,341,000 | 81.16% | $30,575,000 | 16.73% | $3,849,000 | 2.11% | $182,765,000 | ||||
| 2010 | $162,079,000 | 81.87% | $26,121,000 | 13.19% | $9,766,000 | 4.93% | $197,966,000 |
| 2011 | $157,114,000 | 74.23% | $39,899,000 | 18.85% | $14,637,000 | 6.92% | $211,650,000 |
| 2012 | $158,560,000 | 77.19% | $38,527,000 | 18.76% | $8,325,000 | 4.05% | $205,412,000 |
| 2013 | $157,006,000 | 77.65% | $36,574,000 | 18.09% | $8,607,000 | 4.26% | $202,187,000 |
| Avg. | $82,282,619 | 78.75% | $15,222,714 | 17.91% | $3,579,952 | 3.34% | $101,085,286 |
Expenditures
The table below separates the district's expenditures into five categories identified by the agency:
- Instruction: operation expenditures, state payments on behalf of the district for instruction and benefits, and retirement system transfers
- Support Services: support services, food services, and retirement system transfers for support service staff
- Capital Spending: capital outlay expenditures (i.e., construction, land or facilities purchases, and equipment purchases)
- Debt & Gov. Payments: payments to state and local governments and interest on school system debt
- Other: all other non-K-12 programs, except food services
| Expenditures by Category | |||||||||||
|---|---|---|---|---|---|---|---|---|---|---|---|
| Fiscal Year |
Instruction | Support Services | Capital Spending | Debt & Gov. Payments | Other | Budget Total | |||||
| Total | % of Budget | Total | % of Budget | Total | % of Budget | Total | % of Budget | Total | % of Budget | ||
| Click [show] on the right to display the expenditure data for prior years. | |||||||||||
|---|---|---|---|---|---|---|---|---|---|---|---|
| 1993 | $9,625,000 | 47.77% | $6,634,000 | 32.93% | $3,133,000 | 15.55% | $756,000 | 3.75% | $0 | 0.00% | $20,148,000 |
| 1994 | $10,379,000 | 53.22% | $7,899,000 | 40.50% | $500,000 | 2.56% | $718,000 | 3.68% | $7,000 | 0.04% | $19,503,000 |
| 1995 | $12,434,000 | 53.98% | $7,651,000 | 33.22% | $1,375,000 | 5.97% | $1,570,000 | 6.82% | $3,000 | 0.01% | $23,033,000 |
| 1996 | $13,937,000 | 55.01% | $8,353,000 | 32.97% | $1,601,000 | 6.32% | $1,441,000 | 5.69% | $3,000 | 0.01% | $25,335,000 |
| 1997 | $14,810,000 | 50.88% | $8,952,000 | 30.75% | $3,644,000 | 12.52% | $1,526,000 | 5.24% | $178,000 | 0.61% | $29,110,000 |
| 1998 | $15,745,000 | 24.84% | $9,733,000 | 15.36% | $36,451,000 | 57.51% | $1,450,000 | 2.29% | $0 | 0.00% | $63,379,000 |
| 1999 | $17,473,000 | 42.14% | $13,367,000 | 32.24% | $8,665,000 | 20.90% | $1,881,000 | 4.54% | $79,000 | 0.19% | $41,465,000 |
| 2000 | $20,771,000 | 49.28% | $15,609,000 | 37.03% | $2,252,000 | 5.34% | $3,428,000 | 8.13% | $89,000 | 0.21% | $42,149,000 |
| 2001 | $25,081,000 | 44.83% | $18,353,000 | 32.80% | $5,495,000 | 9.82% | $6,947,000 | 12.42% | $74,000 | 0.13% | $55,950,000 |
| 2002 | $25,809,000 | 23.82% | $20,734,000 | 19.14% | $44,704,000 | 41.26% | $17,040,000 | 15.73% | $51,000 | 0.05% | $108,338,000 |
| 2003 | $29,873,000 | 25.59% | $21,900,000 | 18.76% | $43,383,000 | 37.16% | $21,528,000 | 18.44% | $75,000 | 0.06% | $116,759,000 |
| 2004 | $31,587,000 | 25.76% | $24,353,000 | 19.86% | $32,589,000 | 26.58% | $33,922,000 | 27.67% | $155,000 | 0.13% | $122,606,000 |
| 2005 | $34,930,000 | 23.48% | $23,226,000 | 15.61% | $49,502,000 | 33.28% | $40,888,000 | 27.49% | $197,000 | 0.13% | $148,743,000 |
| 2006 | $42,355,000 | 30.03% | $29,638,000 | 21.02% | $15,406,000 | 10.92% | $53,386,000 | 37.85% | $245,000 | 0.17% | $141,030,000 |
| 2007 | $47,671,000 | 29.48% | $33,700,000 | 20.84% | $25,590,000 | 15.82% | $54,498,000 | 33.70% | $270,000 | 0.17% | $161,729,000 |
| 2008 | $56,359,000 | 25.59% | $38,542,000 | 17.50% | $75,465,000 | 34.26% | $49,637,000 | 22.53% | $276,000 | 0.13% | $220,279,000 |
| 2009 | $64,340,000 | 25.69% | $43,608,000 | 17.41% | $87,769,000 | 35.04% | $54,454,000 | 21.74% | $300,000 | 0.12% | $250,471,000 |
| 2010 | $75,244,000 | 30.02% | $48,915,000 | 19.52% | $69,844,000 | 27.87% | $56,346,000 | 22.48% | $292,000 | 0.12% | $250,641,000 |
| 2011 | $82,909,000 | 32.98% | $56,507,000 | 22.48% | $55,567,000 | 22.11% | $56,073,000 | 22.31% | $307,000 | 0.12% | $251,363,000 |
| 2012 | $80,571,000 | 34.46% | $55,755,000 | 23.84% | $43,543,000 | 18.62% | $53,753,000 | 22.99% | $220,000 | 0.09% | $233,842,000 |
| 2013 | $87,375,000 | 35.51% | $62,093,000 | 25.24% | $50,451,000 | 20.51% | $45,882,000 | 18.65% | $241,000 | 0.10% | $246,042,000 |
| Avg. | $38,060,857 | 36.40% | $26,453,429 | 25.19% | $31,282,333 | 21.90% | $26,529,714 | 16.39% | $145,810 | 0.12% | $122,472,143 |
Debt
The table below shows the amount of debt retired, issued, and outstanding in the district for each year.
| Debt | |||
|---|---|---|---|
| Fiscal Year |
Retired | Issued | Outstanding |
| Click [show] on the right to display the debt data for prior years. | |||
|---|---|---|---|
| 1993 | $650,000 | $0 | $27,219,000 |
| 1994 | $760,000 | $0 | $26,459,000 |
| 1995 | $1,250,000 | $0 | $25,209,000 |
| 1996 | $920,000 | $4,305,000 | $28,594,000 |
| 1997 | $4,102,000 | $24,803,000 | $45,421,000 |
| 1998 | $606,000 | $0 | $44,815,000 |
| 1999 | $786,000 | $0 | $45,156,000 |
| 2000 | $1,127,000 | $0 | $43,932,000 |
| 2001 | $1,030,000 | $0 | $44,316,000 |
| 2002 | $2,444,000 | $75,000,000 | $116,872,000 |
| 2003 | $4,274,000 | $47,540,000 | $159,428,000 |
| 2004 | $1,406,000 | $60,115,000 | $217,809,000 |
| 2005 | $24,419,000 | $32,704,000 | $228,422,000 |
| 2006 | $1,749,000 | $68,500,000 | $293,188,000 |
| 2007 | $113,171,000 | $202,680,000 | $383,492,000 |
| 2008 | $5,400,000 | $56,995,000 | $434,919,000 |
| 2009 | $3,575,000 | $63,820,000 | $496,517,000 |
| 2010 | $4,756,000 | $0 | $493,014,000 |
| 2011 | $5,620,000 | $51,805,000 | $540,613,000 |
| 2012 | $65,000,000 | $139,000,000 | $612,607,000 |
| 2013 | $47,483,000 | $44,180,000 | $608,147,000 |
| Avg. | $13,834,667 | $41,497,476 | $234,102,333 |
Teacher salaries
The Northwest Independent School District website does not specify salary ranges for teachers, however more information can be found by clicking here.
Schools in Northwest ISD
Enrollment
Northwest Independent School District serves 15,370 students. Northwest Independent School District does not publicly archive enrollment data.[11]
District schools
Northwest Independent School District operates 27 schools listed below in alphabetical order:[12]
| Northwest Independent School District Schools | ||
|---|---|---|
| School Name | ||
| Beck Elementary School | ||
| Byron Nelson High School | ||
| Chisholm Trail Middle School | ||
| Cox Elementary School | ||
| Granger Elementary School | ||
| Haslet Elementary School | ||
| Hatfield Elementary School | ||
| Hughes Elementary School | ||
| Justin Elementary School | ||
| Lakeview Elementary School | ||
| Love Elementary School | ||
| Medlin Middle School | ||
| Nance Elementary School | ||
| Northwest High School | ||
| Outdoor Learning Center | ||
| Peterson Elementary School | ||
| Pike Middle School | ||
| Prairie View Elementary School | ||
| Roanoke Elementary School | ||
| Schluter Elementary School | ||
| Sendera Ranch Elementary School | ||
| Seven Hills Elementary School | ||
| Special Programs Center | ||
| Steele Accelerated High School | ||
| Thompson Elementary School | ||
| Tidwell Middle School | ||
| Wilson Middle School | ||
Academic performance
The Texas Education Agency issues an annual accountability report for each school district in the state. This rating determines if district schools fulfill expectations in four categories of educational achievement during a particular school year. The following terms explain these categories:
- Student Achievement: Measures student performance on the annual Texas Assessment of Knowledge and Skills (TAKS) test.
- Student Progress: Measures student performance in reading, math and writing courses at the district level.
- Closing Performance Gaps: Measures year-to-year performance among students in the lowest-performing demographics.
- Postsecondary Readiness: Measures student readiness for college, employment or military service after graduation.
Northwest Independent School District received a Met Standard designation on the state's 2013 report. District schools met 96 percent of indicators set forth by state education officials and all four assessment categories. The following table details the district's accountability report during the 2012-2013 school year:[13]
| Performance Index Summary, 2012-2013 | ||||
|---|---|---|---|---|
| Category | Points earned | Maximum points | Index score | Target score |
| Student Achievement | 34,016 | 39,026 | 87 | 50 |
| Student Progress | 1,568 | 4,400 | 36 | 21 |
| Closing Performance Gaps | 816 | 1,000 | 82 | 50 |
| Postsecondary Readiness | 1,028.0 | 1,200 | 86 | 75 |
Issues
Bond measure
In addition to choosing two candidates for the Northwest ISD board of trustees on May 6, 2017, citizens of the Northwest Independent School District approved a $399 million bond measure. The district asked for funds to accommodate student enrollment growth, expanding student programs, technology and infrastructure improvements, facility maintenance, and security enhancements. Because it was approved, the bond increased property taxes by approximately $7.03 per month for owners of homes worth an average of $250,000.[14][15][16][17]
Contact information
![]()
Northwest School Board
2001 Texan Dr.
Justin, TX 76247
Phone: (817) 215-0000
See also
| Texas | School Board Elections | News and Analysis |
|---|---|---|
 |
 | |
External links
Footnotes
- ↑ U.S. Department of Education, National Center for Education Statistics, "Common Core of Data, file ccd_lea_052_1414_w_0216161a, 2014-2015," accessed November 16, 2016
- ↑ Northwest Independent School District, "Adopted Budget," accessed December 12, 2014
- ↑ 3.0 3.1 3.2 United States Census Bureau, "QuickFacts: Tarrant County, Texas," accessed March 10, 2017
- ↑ The Dallas Morning News, "Northwest ISD names new superintendent," accessed July 19, 2016
- ↑ Northwest Independent School District, "Superintendent," accessed November 4, 2019
- ↑ Northwest Independent School District, "Superintendent's Profile," accessed March 12, 2014
- ↑ Northwest Independent School District, "Board of Trustees," accessed March 12, 2014
- ↑ Note: This text is quoted verbatim from the original source. Any inconsistencies are attributable to the original source.
- ↑ Northwest Independent School District, "Public Participation," May 9, 2011
- ↑ United States Census Bureau, "Public School System Finances: Historical Data," accessed December 1, 2015
- ↑ National Center for Education Statistics, "ELSI Table Generator," accessed February 18, 2014
- ↑ Northwest Independent School District, "Schools," accessed March 12, 2014
- ↑ Texas Education Agency, "Accountability Summary 2013," accessed June 24, 2014
- ↑ Cite error: Invalid
<ref>tag; no text was provided for refs namedresults - ↑ Cite error: Invalid
<ref>tag; no text was provided for refs namedresults2 - ↑ Northwest ISD 2017, "What's Proposed," accessed March 13, 2017
- ↑ Northwest ISD 2017, "Questions," accessed March 13, 2017
| |||||
