Wilson County Schools, North Carolina: Difference between revisions
m (Text replacement - "===School board elections===" to "===Election dates===") |
(local coverage disclaimer) |
||
| Line 1: | Line 1: | ||
{{Local scope archive|Type=School district}} | |||
{{School board district infobox | {{School board district infobox | ||
|District =Wilson County Schools | |District =Wilson County Schools | ||
Revision as of 19:57, 10 April 2018
Ballotpedia provides comprehensive election coverage of the 100 largest cities in America by population as well as mayoral, city council, and district attorney election coverage in state capitals outside of the 100 largest cities. This school district is outside of that coverage scope and does not receive scheduled updates.
| Wilson County Schools |
|---|
| Wilson, North Carolina |
| District details |
| Superintendent: Dr. Lane Mills |
| # of school board members: 7 |
| Website: Link |
Wilson County Schools is a school district in North Carolina. The district was the 32nd-largest school district in the state in the 2013–2014 school year and served 12,371 students.[1]
About the district
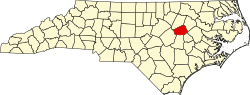
Wilson County Schools is located in Wilson County, North Carolina. The county seat is Wentworth. Wilson County was home to 81,714 residents between 2010 and 2015, according to the United States Census Bureau.[2]
Demographics
Wilson County underperformed in comparison to North Carolina as a whole in terms of higher education attainment from 2010 to 2014. The United States Census Bureau found that 18.4 percent of county residents aged 25 years and older had attained a bachelor's degree or higher, compared to 27.8 percent for state residents. The median household income in the county was $39,332, compared to $46,693 for the state. County residents lived below the poverty level at a rate of 23.9 percent, while that rate was 16.4 percent for state residents.[2]
|
| |||||||||||||||||||||||||||||||||||||||||||||
Note: Percentages for race and ethnicity may add up to more than 100 percent because respondents may report more than one race and the Hispanic/Latino ethnicity may be selected in conjunction with any race. Read more about race and ethnicity in the census here.
Superintendent
| |
This information is updated as we become aware of changes. Please contact us with any updates. |
Dr. Lane Mills (2016-Present)
The superintendent of Wilson County Schools is Dr. Lane Mills. Mills assumed the post on July 1, 2016, and signed on for a four-year term. Immediately prior to his appointment, he served as the superintendent of Craven County Schools. He has also worked as the assistant superintendent of accountability and technology in Wilson schools and was an associate professor of educational leadership at East Carolina University.[4]
Past superintendents
Sean Bulson (2011-2016)
Sean Bulson was named as superintendent by the school board in April 2011, and officially assumed the role on July 1, 2011. He had been serving as community superintendent for Montgomery County Public Schools in Maryland at the time. Bulson has also worked as a teacher and high school principal. The school board signed Bulson to a four-year contact at a salary of $165,000 per year.[5][6] In February 2016, Bulson announced his resignation effective June 30, 2016, to become senior vice president at N.C. New Schools/Breakthrough Learning.[7]
School board elections
Wilson County schools are overseen by a seven-member board elected by district to four-year terms.[8]
| Wilson County School Board | |||
|---|---|---|---|
| Member | District | Assumed Office | Term Ends |
| Debora Powell | 1 | 2010 | 2018 |
| Velma Barnes | 2 | 2013 | 2020 |
| Christine L. Fitch | 3 | 1989 | 2018 |
| Henry Mercer | 4 | 2020 | |
| Beverly Boyette | 5 | 2018 | |
| Gary W. Farmer | 6 | 2020 | |
| Robin Flinn | 7 | 2016 | 2018 |
Election dates
Members of the Wilson County school board are elected to four-year terms. Elections are held every even-numbered year. Four seats were up for election in 2014 and three seats were up for election in 2016.
Public participation in board meetings
The Wilson County school board maintains the following policy on public testimony during board meetings:
| “ | The Board encourages communication with the public and cooperative school-community interactions, believing that an informed public and an informed Board will result in a better system of public education. Accordingly, the Board welcomes and encourages input from any interested citizen who desires to appear before the Board for the purpose of presenting information or raising matters relating to the public schools. In addition to other methods by which members of the public may bring matters of interest to the attention of the Board, time will be set aside as a part of the Board's regular meeting agenda for the specific purpose of allowing members of the public to address the Board. The purpose of this time is for the Board to hear matters of interest from the public; therefore, dialogue between the speaker and Board members will not be allowed. However, Board members may ask clarifying questions. To facilitate this communication and to plan and conduct orderly sessions that will ensure complete, high quality information is available regarding the subject of such appearances, it is necessary that certain guide lines contained in this policy be followed.
1326.1 Citizens are advised that, in addition to the methods provided in this policy, they may request that an item be considered to be placed on the Board agenda by contacting the Superintendent in accordance with Board Policy 1321.
If the matter is presently under review by the Administration, then the Chairman may defer the individual’s appearance to the next Board meeting.
1326.6 Presentations will be limited to three minutes per person. An organization or delegation representing the same concern is encouraged to select one individual to make a presentation on its behalf.[9] |
” |
| —Wilson County Schools website (2010)[10] | ||
Budget
From 1993 to 2013, the Wilson County school district had an average of $87,810,571 in revenue and $86,751,429 in expenditures, according to the United States Census Bureau's survey of school system finances. The district had a yearly average of $27,300,190 in outstanding debt. The district retired $3,096,000 of its debt and issued $3,748,381 in new debt each year on average.[11]
Revenue
The table below separates the district's revenue into the three sources identified by the agency: local, state, and federal.
| Revenue by Source | |||||||||||
|---|---|---|---|---|---|---|---|---|---|---|---|
| Fiscal Year |
Local | State | Federal | Revenue Total | |||||||
| Total | % of Revenue | Total | % of Revenue | Total | % of Revenue | ||||||
| Click [show] on the right to display the revenue data for prior years. | |||||||||||
|---|---|---|---|---|---|---|---|---|---|---|---|
| 1993 | $13,360,000 | 24.01% | $35,901,000 | 64.52% | $6,382,000 | 11.47% | $55,643,000 | ||||
| 1994 | $14,091,000 | 24.16% | $37,620,000 | 64.51% | $6,607,000 | 11.33% | $58,318,000 | ||||
| 1995 | $15,161,000 | 25.04% | $39,181,000 | 64.71% | $6,206,000 | 10.25% | $60,548,000 | ||||
| 1996 | $16,311,000 | 25.50% | $40,767,000 | 63.74% | $6,878,000 | 10.75% | $63,956,000 | ||||
| 1997 | $19,128,000 | 27.93% | $43,242,000 | 63.14% | $6,113,000 | 8.93% | $68,483,000 | ||||
| 1998 | $19,453,000 | 27.47% | $44,922,000 | 63.44% | $6,439,000 | 9.09% | $70,814,000 | ||||
| 1999 | $19,512,000 | 25.32% | $50,527,000 | 65.58% | $7,011,000 | 9.10% | $77,050,000 | ||||
| 2000 | $20,465,000 | 25.08% | $53,738,000 | 65.86% | $7,390,000 | 9.06% | $81,593,000 | ||||
| 2001 | $21,761,000 | 23.75% | $62,366,000 | 68.06% | $7,505,000 | 8.19% | $91,632,000 | ||||
| 2002 | $21,190,000 | 24.99% | $54,786,000 | 64.62% | $8,803,000 | 10.38% | $84,779,000 | ||||
| 2003 | $18,218,000 | 22.53% | $52,316,000 | 64.69% | $10,339,000 | 12.78% | $80,873,000 | ||||
| 2004 | $24,082,000 | 26.61% | $55,870,000 | 61.75% | $10,533,000 | 11.64% | $90,485,000 | ||||
| 2005 | $25,889,000 | 26.82% | $58,528,000 | 60.64% | $12,097,000 | 12.53% | $96,514,000 | ||||
| 2006 | $25,411,000 | 25.69% | $60,970,000 | 61.64% | $12,527,000 | 12.67% | $98,908,000 | ||||
| 2007 | $26,475,000 | 25.65% | $64,389,000 | 62.39% | $12,341,000 | 11.96% | $103,205,000 | ||||
| 2008 | $29,207,000 | 26.45% | $67,820,000 | 61.41% | $13,407,000 | 12.14% | $110,434,000 | ||||
| 2009 | $29,920,000 | 26.30% | $70,705,000 | 62.15% | $13,147,000 | 11.56% | $113,772,000 | ||||
| 2010 | $28,512,000 | 26.72% | $60,752,000 | 56.94% | $17,426,000 | 16.33% | $106,690,000 |
| 2011 | $46,991,000 | 36.84% | $61,568,000 | 48.27% | $18,979,000 | 14.88% | $127,538,000 |
| 2012 | $20,516,000 | 20.23% | $63,889,000 | 62.99% | $17,022,000 | 16.78% | $101,427,000 |
| 2013 | $20,798,000 | 20.52% | $65,917,000 | 65.03% | $14,645,000 | 14.45% | $101,360,000 |
| Avg. | $22,688,143 | 25.60% | $54,560,667 | 62.67% | $10,561,762 | 11.73% | $87,810,571 |
Expenditures
The table below separates the district's expenditures into five categories identified by the agency:
- Instruction: operation expenditures, state payments on behalf of the district for instruction and benefits, and retirement system transfers
- Support Services: support services, food services, and retirement system transfers for support service staff
- Capital Spending: capital outlay expenditures (i.e., construction, land or facilities purchases, and equipment purchases)
- Debt & Gov. Payments: payments to state and local governments and interest on school system debt
- Other: all other non-K-12 programs, except food services
| Expenditures by Category | |||||||||||
|---|---|---|---|---|---|---|---|---|---|---|---|
| Fiscal Year |
Instruction | Support Services | Capital Spending | Debt & Gov. Payments | Other | Budget Total | |||||
| Total | % of Budget | Total | % of Budget | Total | % of Budget | Total | % of Budget | Total | % of Budget | ||
| Click [show] on the right to display the expenditure data for prior years. | |||||||||||
|---|---|---|---|---|---|---|---|---|---|---|---|
| 1993 | $33,433,000 | 61.25% | $17,666,000 | 32.37% | $2,729,000 | 5.00% | $570,000 | 1.04% | $184,000 | 0.34% | $54,582,000 |
| 1994 | $34,495,000 | 60.77% | $19,379,000 | 34.14% | $2,187,000 | 3.85% | $469,000 | 0.83% | $234,000 | 0.41% | $56,764,000 |
| 1995 | $36,365,000 | 62.06% | $19,591,000 | 33.43% | $2,003,000 | 3.42% | $358,000 | 0.61% | $282,000 | 0.48% | $58,599,000 |
| 1996 | $37,361,000 | 61.09% | $19,772,000 | 32.33% | $3,485,000 | 5.70% | $260,000 | 0.43% | $276,000 | 0.45% | $61,154,000 |
| 1997 | $39,660,000 | 59.95% | $20,399,000 | 30.84% | $5,621,000 | 8.50% | $163,000 | 0.25% | $307,000 | 0.46% | $66,150,000 |
| 1998 | $41,844,000 | 52.73% | $21,315,000 | 26.86% | $14,677,000 | 18.50% | $1,170,000 | 1.47% | $343,000 | 0.43% | $79,349,000 |
| 1999 | $45,576,000 | 58.27% | $22,788,000 | 29.14% | $8,319,000 | 10.64% | $1,086,000 | 1.39% | $446,000 | 0.57% | $78,215,000 |
| 2000 | $47,991,000 | 58.05% | $26,034,000 | 31.49% | $7,156,000 | 8.66% | $1,001,000 | 1.21% | $488,000 | 0.59% | $82,670,000 |
| 2001 | $51,063,000 | 51.24% | $27,863,000 | 27.96% | $18,972,000 | 19.04% | $1,148,000 | 1.15% | $616,000 | 0.62% | $99,662,000 |
| 2002 | $50,634,000 | 58.33% | $27,512,000 | 31.69% | $6,475,000 | 7.46% | $1,649,000 | 1.90% | $534,000 | 0.62% | $86,804,000 |
| 2003 | $49,820,000 | 52.33% | $28,250,000 | 29.67% | $13,845,000 | 14.54% | $2,780,000 | 2.92% | $517,000 | 0.54% | $95,212,000 |
| 2004 | $49,606,000 | 57.56% | $30,603,000 | 35.51% | $2,678,000 | 3.11% | $2,772,000 | 3.22% | $519,000 | 0.60% | $86,178,000 |
| 2005 | $55,539,000 | 59.01% | $32,206,000 | 34.22% | $3,210,000 | 3.41% | $2,596,000 | 2.76% | $564,000 | 0.60% | $94,115,000 |
| 2006 | $55,072,000 | 58.39% | $34,636,000 | 36.72% | $2,198,000 | 2.33% | $2,404,000 | 2.55% | $14,000 | 0.01% | $94,324,000 |
| 2007 | $57,220,000 | 58.19% | $36,566,000 | 37.18% | $1,784,000 | 1.81% | $2,202,000 | 2.24% | $565,000 | 0.57% | $98,337,000 |
| 2008 | $60,547,000 | 58.34% | $34,771,000 | 33.50% | $5,350,000 | 5.15% | $1,998,000 | 1.93% | $1,124,000 | 1.08% | $103,790,000 |
| 2009 | $65,376,000 | 55.68% | $38,116,000 | 32.46% | $9,500,000 | 8.09% | $2,960,000 | 2.52% | $1,459,000 | 1.24% | $117,411,000 |
| 2010 | $58,570,000 | 57.68% | $37,719,000 | 37.15% | $950,000 | 0.94% | $3,372,000 | 3.32% | $930,000 | 0.92% | $101,541,000 |
| 2011 | $60,160,000 | 58.01% | $37,992,000 | 36.63% | $1,205,000 | 1.16% | $3,131,000 | 3.02% | $1,223,000 | 1.18% | $103,711,000 |
| 2012 | $57,686,000 | 57.64% | $37,785,000 | 37.76% | $1,450,000 | 1.45% | $2,287,000 | 2.29% | $870,000 | 0.87% | $100,078,000 |
| 2013 | $60,044,000 | 58.22% | $40,476,000 | 39.25% | $1,737,000 | 1.68% | $0 | 0.00% | $877,000 | 0.85% | $103,134,000 |
| Avg. | $49,907,714 | 57.85% | $29,116,143 | 33.35% | $5,501,476 | 6.40% | $1,636,952 | 1.76% | $589,143 | 0.64% | $86,751,429 |
Debt
The table below shows the amount of debt retired, issued, and outstanding in the district for each year.
| Debt | |||
|---|---|---|---|
| Fiscal Year |
Retired | Issued | Outstanding |
| Click [show] on the right to display the debt data for prior years. | |||
|---|---|---|---|
| 1993 | $1,500,000 | $0 | $7,000,000 |
| 1994 | $1,500,000 | $0 | $5,500,000 |
| 1995 | $1,500,000 | $0 | $4,000,000 |
| 1996 | $1,500,000 | $0 | $2,500,000 |
| 1997 | $1,500,000 | $17,000,000 | $18,000,000 |
| 1998 | $1,286,000 | $0 | $16,714,000 |
| 1999 | $1,322,000 | $0 | $15,392,000 |
| 2000 | $1,031,000 | $5,000,000 | $19,362,000 |
| 2001 | $0 | $10,213,000 | $27,871,000 |
| 2002 | $0 | $17,400,000 | $42,769,000 |
| 2003 | $1,026,000 | $903,000 | $42,646,000 |
| 2004 | $2,708,000 | $0 | $39,939,000 |
| 2005 | $2,955,000 | $0 | $36,984,000 |
| 2006 | $3,101,000 | $0 | $33,882,000 |
| 2007 | $3,150,000 | $0 | $30,733,000 |
| 2008 | $3,200,000 | $18,000,000 | $45,533,000 |
| 2009 | $3,352,000 | $0 | $42,180,000 |
| 2010 | $3,707,000 | $0 | $48,173,000 |
| 2011 | $23,190,000 | $10,200,000 | $35,183,000 |
| 2012 | $3,936,000 | $0 | $31,247,000 |
| 2013 | $3,552,000 | $0 | $27,696,000 |
| Avg. | $3,096,000 | $3,748,381 | $27,300,190 |
Teacher salaries
Wilson County Schools employed 749 K-12 teachers during the 2011-2012 school year.[12]
The following table details the 2014-2015 starting salary schedule for classroom teachers in North Carolina public schools. Salaries are assigned based on class level of a teacher's license, their experience level and area of assignment. Those who currently hold National Board for Professional Teaching Standards (NBPTS) certification receive a higher salary.[13][14]
| Salary structure | ||
|---|---|---|
| Degree level | Minimum salary ($) | Maximum salary ($) |
| Bachelor's | 33,000 | 50,000 |
| Bachelor's + NBPTS | 36,960 | 56,000 |
| Master's | 36,300 | 55,000 |
| Master's + NBPTS | 40,260 | 61,000 |
| 6-Year | 37,560 | 56,260 |
| 6-Year + NBPTS | 41,520 | 62,260 |
| Doctoral | 38,830 | 57,530 |
| Doctoral + NBPTS | 42,790 | 63,530 |
Schools in Wilson County
Enrollment
Wilson County Schools served 12,380 students in 25 schools during the 2011-2012 school year.[12] The district does not provide historical enrollment data.
District schools
Wilson County Schools operates 25 schools listed below in alphabetical order:
| Wilson County Schools |
|---|
| Barnes Elementary School |
| Beddingfield High School |
| Daniels Learning Center |
| Darden Middle School |
| Elm City Elementary School |
| Elm City Middle School |
| Fike High School |
| Forest Hills Middle School |
| Gardeners Elementary School |
| Hearne Elementary School |
| Hunt High School |
| Jones Elementary School |
| Lee Woodard Elementary School |
| Lucama Elementary School |
| New Hope Elementary School |
| Rock Ridge Elementary School |
| Speight Middle School |
| Springfield Middle School |
| Stantonsburg Elementary School |
| Toisnot Middle School |
| Vick Elementary School |
| Vinson-Bynum Elementary School |
| Wells Elementary School |
| Wilson Early College Academy |
| Winstead Elementary School |
Academic performance
North Carolina conducts standardized End-of-Course (EOC) tests "to provide a global estimate of the student’s mastery of the material in a particular content area."[15] Students in grades nine though 12 are required to take tests in English I, Biology and Algebra I.
The following table displays composite test results for all students in Wilson County Schools who took all tests:[16]
- Note: Results from 2011-2012 contain retests while those from 2012-2013 do not.
| District assessment | |||
|---|---|---|---|
| Year | # At or Above Level III | # Valid Scores | % At or Above Level III |
| 2011-2012 | 2,414 | 2,734 | 88.3% |
| 2012-2013 | 990 | 2,836 | 34.9% |
Contact information

Wilson County Schools
117 N. Tarboro St.
P.O. Box 2048
Wilson, NC 27894
Phone: 252-399-7700
Fax: 252-399-2776
See also
- North Carolina
- North Carolina school districts
- List of school districts in North Carolina
- Wilson County Schools, North Carolina elections (2014)
- School board elections portal
External links
- Wilson County Schools
- North Carolina Association of Educators
- Classroom Teachers Association of North Carolina
- Wilson County, North Carolina
- North Carolina Department of Public Instruction
- North Carolina School Boards Association
Footnotes
- ↑ National Center for Education Statistics, "ELSI Table Generator," accessed November 16, 2015
- ↑ 2.0 2.1 2.2 United States Census Bureau, "Wilson County, North Carolina," accessed October 3, 2016
- ↑ North Carolina State Board of Elections, "NC Voter Statistics Results," accessed September 2, 2014
- ↑ Wilson County Schools, "Dr. Mills Named Superintendent," accessed July 26, 2016
- ↑ Wilson Times, "Superintendent Named," April 6, 2011
- ↑ Wilson County Schools, "Office of the Superintendent," accessed December 3, 2014
- ↑ The Wilson Times, "Bulson resigns for new post," accessed July 26, 2016
- ↑ Wilson County Schools, "Board of Education," accessed December 3, 2014
- ↑ Note: This text is quoted verbatim from the original source. Any inconsistencies are attributable to the original source.
- ↑ Wilson County Schools, "School Board Policies," accessed February 18, 2016
- ↑ United States Census Bureau, "Public School System Finances: Historical Data," accessed December 1, 2015
- ↑ 12.0 12.1 Cite error: Invalid
<ref>tag; no text was provided for refs namedenrollment - ↑ Public Schools of North Carolina, "NC Public School Personnel State Salary Manual," accessed November 29, 2014
- ↑ Public Schools of North Carolina, "2014-2015 Salary Schedules," accessed November 29, 2014
- ↑ Public Schools of North Carolina, "North Carolina End-of-Course Tests," accessed November 28, 2014
- ↑ Public Schools of North Carolina, "Reports of Disaggregated State, School System (LEA) and School Performance Data for 2011 - 2013," accessed November 28, 2014
| |||||
 |
State of North Carolina Raleigh (capital) |
|---|---|
| Elections |
What's on my ballot? | Elections in 2026 | How to vote | How to run for office | Ballot measures |
| Government |
Who represents me? | U.S. President | U.S. Congress | Federal courts | State executives | State legislature | State and local courts | Counties | Cities | School districts | Public policy |