Illinois' 3rd Congressional District: Difference between revisions
m (Text replacement - "www\.opencongress\.org\/states\/([A-Z]{2})\/districts\/([0-9]{1,2}) OpenCongress District" to "www.govtrack.us/congress/members/$1/$2 GovTrack District") |
No edit summary |
||
| Line 18: | Line 18: | ||
==Elections== | ==Elections== | ||
===2020=== | |||
:: ''See also: [[Illinois' 3rd Congressional District election, 2020]]'' | |||
<APIWidget where='races.id=31362' template='CandidateList' extra_params='{"type":"general","subtype":"all","include_declared_candidates":true}' /><br> | |||
<APIWidget where='races.id=31362' template='CandidateList' extra_params='{"type":"primary","subtype":"democratic","include_declared_candidates":true}' /><br><APIWidget where='races.id=31362' template='CandidateList' extra_params='{"type":"primary","subtype":"republican","include_declared_candidates":true}' /> | |||
===2018=== | ===2018=== | ||
:: ''See also: [[Illinois' 3rd Congressional District election, 2018]]'' | :: ''See also: [[Illinois' 3rd Congressional District election, 2018]]'' | ||
{ | <APIWidget where='races.office_name="U.S. House Illinois District 3" and races.year="2018" and races.office_district_state="IL" and races.type="Regular"' template='ElectionSection' extra_params='{"type":"all"}' /> | ||
===2016=== | ===2016=== | ||
{{IL3 cong 2016}} | {{IL3 cong 2016}} | ||
===2014=== | ===2014=== | ||
::''See also: [[Illinois' 3rd Congressional District elections, 2014]]'' | ::''See also: [[Illinois' 3rd Congressional District elections, 2014]]'' | ||
| Line 66: | Line 69: | ||
==See also== | ==See also== | ||
*[[Redistricting in Illinois]] | *[[Redistricting in Illinois]] | ||
*[[Illinois' 3rd Congressional District | *[[Illinois' 3rd Congressional District election, 2020]] | ||
==External links== | ==External links== | ||
Revision as of 19:39, 6 September 2019
| Illinois' 3rd Congressional District |
|---|
 |
| Incumbent Daniel Lipinski Cook Partisan Voter Index (2018): D+6 |
| U.S. Census Bureau (2010 data)[1] |
| Population: 713,092 |
| Gender: 49.6% Male, 50.4% Female |
| Race[2]: 78.8% White, 3.8% Black, 3.3% Asian, 0.3% Native American |
| Ethnicity: 29.4% Hispanic |
| Unemployment: 13.3% |
| Median household income $56,579 |
| High school graduation rate 83.6% |
| College graduation rate 24.9% |
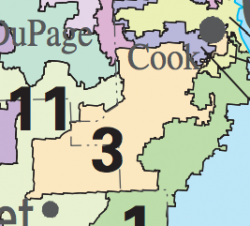
Illinois' 3rd Congressional District includes western and southwestern suburbs of Chicago as well as a portion of the southwest side of the city of Chicago itself. Parts of Cook, DuPage and Will counties lie within the district.[3]
The current representative of the 3rd Congressional District is Daniel Lipinski (D).
Elections
2020
General election candidates
- Marie Newman (Democratic Party) ✔

- Mike Fricilone (Republican Party)
![]() = candidate completed Ballotpedia's Candidate Connection survey
= candidate completed Ballotpedia's Candidate Connection survey
![]() Democratic primary candidates
Democratic primary candidates
- Daniel Lipinski (Incumbent)
- Rush Darwish
- Charles Hughes
- Marie Newman ✔
Did not make the ballot:
![]() = candidate completed Ballotpedia's Candidate Connection survey
= candidate completed Ballotpedia's Candidate Connection survey![]() Republican primary candidates
Republican primary candidates
2018
General election
General election for U.S. House Illinois District 3
Incumbent Daniel Lipinski defeated Arthur Jones in the general election for U.S. House Illinois District 3 on November 6, 2018.
Candidate | % | Votes | ||
| ✔ |  | Daniel Lipinski (D) | 73.0 | 163,053 |
 | Arthur Jones (R) | 25.9 | 57,885 | |
| Other/Write-in votes | 1.1 | 2,396 | ||
| Total votes: 223,334 (100.00% precincts reporting) | |||
| If you are a candidate and would like to tell readers and voters more about why they should vote for you, complete the Ballotpedia Candidate Connection Survey. | ||||
Do you want a spreadsheet of this type of data? Contact our sales team. | ||||
Withdrawn or disqualified candidates
- Mat Tomkowiak (Independent)
Democratic primary election
Democratic primary for U.S. House Illinois District 3
Incumbent Daniel Lipinski defeated Marie Newman in the Democratic primary for U.S. House Illinois District 3 on March 20, 2018.
Candidate | % | Votes | ||
| ✔ | | Daniel Lipinski | 51.1 | 48,675 |
 | Marie Newman | 48.9 | 46,530 | |
| Total votes: 95,205 | |||
| If you are a candidate and would like to tell readers and voters more about why they should vote for you, complete the Ballotpedia Candidate Connection Survey. | ||||
Do you want a spreadsheet of this type of data? Contact our sales team. | ||||
Republican primary election
Republican primary for U.S. House Illinois District 3
Arthur Jones advanced from the Republican primary for U.S. House Illinois District 3 on March 20, 2018.
Candidate | % | Votes | ||
| ✔ | | Arthur Jones | 100.0 | 20,681 |
| Total votes: 20,681 | |||
| If you are a candidate and would like to tell readers and voters more about why they should vote for you, complete the Ballotpedia Candidate Connection Survey. | ||||
Do you want a spreadsheet of this type of data? Contact our sales team. | ||||
2016
Heading into the election, Ballotpedia rated this race as safely Democratic. Incumbent Daniel Lipinski (D) was unopposed in the general election on November 8, 2016, as the only Republican to file, Arthur Jones, was removed from the ballot prior to the primary. Lipinski also faced no opposition in the Democratic primary on March 15, 2016.[4][5]
| Party | Candidate | Vote % | Votes | |
|---|---|---|---|---|
| Democratic | 100% | 225,320 | ||
| N/A | Write-in | 0% | 91 | |
| Total Votes | 225,411 | |||
| Source: Illinois State Board of Elections | ||||
2014
The 3rd Congressional District of Illinois held an election for the U.S. House of Representatives on November 4, 2014. Incumbent Daniel Lipinski (D) defeated challenger Sharon Brannigan (R) in the general election.
| Party | Candidate | Vote % | Votes | |
|---|---|---|---|---|
| Democratic | 64.6% | 116,764 | ||
| Republican | Sharon Brannigan | 35.4% | 64,091 | |
| Total Votes | 180,855 | |||
| Source: Illinois State Board of Elections Official Results | ||||
General election candidates
 Sharon Brannigan
 Daniel Lipinski - Incumbent
March 18, 2014, primary results
|
|
|
2012
The 3rd Congressional District of Illinois held an election for the U.S. House of Representatives on November 6, 2012. Incumbent Daniel Lipinski won re-election in the district.[8]
| Party | Candidate | Vote % | Votes | |
|---|---|---|---|---|
| Democratic | 68.5% | 168,738 | ||
| Republican | Richard Grabowski | 31.5% | 77,653 | |
| Total Votes | 246,391 | |||
| Source: Illinois Board of Elections "2012 General Election Official Vote Totals" | ||||
2010
On November 2, 2010, Daniel Lipinski won re-election to the United States House. He defeated Michael A. Bendas (R) and Laurel Lambert Schmidt (G) in the general election.[9]
| U.S. House, Illinois District 3 General Election, 2010 | ||||
|---|---|---|---|---|
| Party | Candidate | Vote % | Votes | |
| Democratic | 69.7% | 116,120 | ||
| Republican | Michael A. Bendas | 24.3% | 40,479 | |
| Green | Laurel Lambert Schmidt | 6% | 10,028 | |
| Total Votes | 166,627 | |||
2008
On November 4, 2008, Daniel Lipinski won re-election to the United States House. He defeated Michael Hawkins (R) and Jerome Pohlen (G) in the general election.[10]
| U.S. House, Illinois District 3 General Election, 2008 | ||||
|---|---|---|---|---|
| Party | Candidate | Vote % | Votes | |
| Democratic | 73.3% | 172,581 | ||
| Republican | Michael Hawkins | 21.4% | 50,336 | |
| Green | Jerome Pohlen | 5.4% | 12,607 | |
| Total Votes | 235,524 | |||
2006
On November 7, 2006, Daniel Lipinski won re-election to the United States House. He defeated Raymond G. Wardingley (R) in the general election.[11]
| U.S. House, Illinois District 3 General Election, 2006 | ||||
|---|---|---|---|---|
| Party | Candidate | Vote % | Votes | |
| Democratic | 77.1% | 127,768 | ||
| Republican | Raymond G. Wardingley | 22.9% | 37,954 | |
| Total Votes | 165,722 | |||
2004
On November 2, 2004, Daniel Lipinski won election to the United States House. He defeated Ryan Chlada (R) in the general election.[12]
| U.S. House, Illinois District 3 General Election, 2004 | ||||
|---|---|---|---|---|
| Party | Candidate | Vote % | Votes | |
| Democratic | 72.6% | 167,034 | ||
| Republican | Ryan Chlada | 25.2% | 57,845 | |
| N/A | Write-in | 2.2% | 5,077 | |
| Total Votes | 229,956 | |||
2002
William O. Lipinski (D) ran unopposed for re-election in 2002.
2000
On November 7, 2000, William O. Lipinski won re-election to the United States House. He defeated Karl Groth (R) in the general election.[13]
| U.S. House, Illinois District 3 General Election, 2000 | ||||
|---|---|---|---|---|
| Party | Candidate | Vote % | Votes | |
| Democratic | 75.6% | 145,498 | ||
| Republican | Karl Groth | 24.4% | 47,005 | |
| Total Votes | 192,503 | |||
Redistricting
2010-2011

- See also: Redistricting in Illinois
In 2011, the Illinois State Legislature re-drew the congressional districts based on updated population information from the 2010 census.
District analysis
- See also: The Cook Political Report's Partisan Voter Index
- See also: FiveThirtyEight's elasticity scores
The 2017 Cook Partisan Voter Index for this district was D+6, meaning that in the previous two presidential elections, this district's results were 6 percentage points more Democratic than the national average. This made Illinois' 3rd Congressional District the 156th most Democratic nationally.[14]
FiveThirtyEight's September 2018 elasticity score for states and congressional districts measured "how sensitive it is to changes in the national political environment." This district's elasticity score was 1.00. This means that for every 1 point the national political mood moved toward a party, the district was expected to move 1.00 points toward that party.[15]
See also
External links
Footnotes
- ↑ Demographic data were added to this page in 2013. Ballotpedia will update this page in 2021 after data from the 2020 Census become available.
- ↑ Note: Percentages for race and ethnicity may add up to more than 100 percent because respondents may report more than one race and the Hispanic/Latino ethnicity may be selected in conjunction with any race. Read more about race and ethnicity in the census here.
- ↑ United States Census Bureau, "Counties by Congressional Districts," accessed June 8, 2016
- ↑ Illinois State Board of Elections, "Candidate List," accessed November 30, 2015
- ↑ The New York Times, "Illinois Primary Results," March 15, 2016
- ↑ Harris for Congress "Home" Accesse dJuly 13, 2013
- ↑ Illinois Election Division, "Candidate detail: Sharon Brannigan," accessed November 27, 2013
- ↑ Politico, "2012 Election Map, Illinois"
- ↑ U.S. Congress House Clerk, "Statistics of the Congressional Election of November 2, 2010," accessed March 28, 2013
- ↑ U.S. Congress House Clerk, "Statistics of the Congressional Election of November 4, 2008," accessed March 28, 2013
- ↑ U.S. Congress House Clerk, "Statistics of the Congressional Election of November 7, 2006," accessed March 28, 2013
- ↑ U.S. Congress House Clerk, "Statistics of the Congressional Election of November 2, 2004," accessed March 28, 2013
- ↑ U.S. Congress House Clerk, "Statistics of the Congressional Election of November 7, 2000," accessed March 28, 2013
- ↑ Cook Political Report, "Introducing the 2017 Cook Political Report Partisan Voter Index," April 7, 2017
- ↑ FiveThirtyEight, "Election Update: The Most (And Least) Elastic States And Districts," September 6, 2018
