Watertown Unified School District, Wisconsin
| Watertown Unified School District |
|---|
| Dodge and Jefferson Counties, Wisconsin |
| District details |
| Superintendent: Cassandra Schug |
| # of school board members: 9 members |
| Website: Link |
The Watertown Unified School District is a school district in Wisconsin. It was the 49th-largest school district in the state in the 2014-2015 school year and served 3,876 students.[1]
About the district
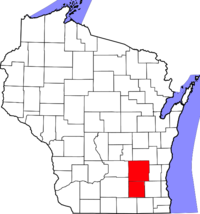
The Watertown Unified School District is located in Dodge and Jefferson counties in southeastern Wisconsin. The county seat of Dodge County is Juneau, and the county seat of Jefferson County is Jefferson. In 2015, Dodge and Jefferson Counties were home to 88,502 residents and 84,559 residents, respectively.[2]
Higher education achievement
Both counties underperformed compared to Wisconsin as a whole in terms of higher education achievement between 2011 and 2015. The United States Census Bureau found that 16.4 percent of Dodge County residents and 22.6 percent of Jefferson County residents aged 25 years and older had attained a bachelor's degree, compared to 27.8 percent of state residents.[2]
Median household income
From 2011 to 2015, the median household income for Dodge County was $53,783, and it was $56,877 for Jefferson County. During that same time period, the median household income for Wisconsin was $53,357. For the United States, it was $53,889.[2]
Poverty rate
From 2011 to 2015, the poverty rate in Dodge County was 8.7 percent, and it was 9.2 percent for Jefferson County. During that same period, the poverty rate for the entire state was 12.1 percent, and for the entire country it was 13.5 percent.[2]
Racial demographics
| Racial Demographics, 2015[2] | |||
|---|---|---|---|
| Race | Dodge County (%) | Jefferson County (%) | Wisconsin (%) |
| White | 94.6 | 96.3 | 87.6 |
| Black or African American | 3.1 | 1.0 | 6.6 |
| American Indian and Alaska Native | 0.6 | 0.5 | 1.1 |
| Asian | 0.7 | 0.9 | 2.8 |
| Native Hawaiian or Other Pacific Islander | 0.1 | 0.0 | 0.1 |
| Two or more races | 1.0 | 1.2 | 1.8 |
| Hispanic or Latino | 4.6 | 7.1 | 6.6 |
Note: Percentages for race and ethnicity may add up to more than 100 percent because respondents may report more than one race and the Hispanic/Latino ethnicity may be selected in conjunction with any race. Read more about race and ethnicity in the census here.
Superintendent
| |
This information is updated as we become aware of changes. Please contact us with any updates. |

Cassandra Schug is the superintendent of the Watertown Unified School District.[3] She has served in this position since July 2011.[4] For the 2015-2016 school year, Schug was paid an annual salary of $140,984.[5]
School board elections
The Watertown Board of Education consists of nine members elected at large to three-year terms.[6]
| Watertown Board of Education | |
|---|---|
| Member | Term Ends |
| Tony Arnett | 2021 |
| Jennifer Bakke | 2021 |
| Ron Buchanan | 2019 |
| Mark Holland | 2021 |
| Steve Kauffeld | 2019 |
| Paul VanDenLangenberg | 2019 |
| Frances Milburn | 2021 |
| Fred Jandt | 2021 |
| Karrie Uttech | 2021 |
| |
This officeholder information was last updated on July 15, 2018. Please contact us with any updates. | |
Governing majority
2017-2018
| Watertown Unified School District Board of Education, 2017-2018 |
|---|
| Mark Putra |
| Steve Kauffeld |
| Jennifer Bakke |
| Tony Arnett |
| Ron Buchanan |
| Paul VanDenLangenberg |
| Mark Holland |
| Karrie Uttech |
| Frances Milburn |
The Watertown Unified School District Board of Education voted unanimously on 97.33 percent of its votes between April 24, 2017, and January 22, 2018. The board approved 73 out of 75 of its motions during this time period, excluding roll call, adjournment, and procedural votes. These votes were counted from special and regularly scheduled sessions and exclude committee meetings.[7]
Due to the number of unanimous votes tallied during this period, no governing majority or minority faction could be identified.[7]
Absences
Frances Milburn was absent for 13.33 percent of votes cast by the board between April 24, 2017, and January 22, 2018, a higher absence rate than any other member. Steve Kauffeld and Karrie Uttech tied for the second-highest absence rate, each missing 10.67 percent of all votes cast during that period. Four board members (Mark Putra, Jennifer Bakke, Mark Holland, and Paul VanDenLangenberg) missed no votes during this period.[7]
Issues
Fiscal/budgetary and personnel accounted for the highest percentage of issues the board voted on between April 24, 2017, and January 22, 2018, each representing 29.3 percent of all votes tracked. See the bar chart below for further details.
School board elections
Members of the Watertown Board of Education are elected at large to three-year terms. Three members are up for election on a staggered basis every year in April.[6]
Public participation in board meetings
The Watertown Board of Education maintains the following policy on public testimony during board meetings:
| “ | Public Participation at Board Meetings The School Board encourages citizens of the District to attend its meetings so that they may become better acquainted with the operations and programs of the schools and so that the Board may have an opportunity to hear the views and concerns of the public regarding educational issues. A period of public comment shall be scheduled at the beginning and end of each regular and special Board meeting except those held in closed session. Citizen comments during the period for public comment at regular monthly Board meetings may address any topic related to District operations and programs. During the public comment period, the Board shall not consider or discuss complaints or grievances regarding individual staff members. Such concerns should be initially brought to the staff member’s immediate supervisor or submitted as a complaint in accordance with District complaint procedures. The Board shall listen to citizen views and concerns but shall not act on any matter that was not specifically included in the public notice of the meeting. The Board President shall recognize all speakers. Each person when called upon will give his/her name and address and the name of any group they represent. Speakers shall be as brief as possible and only speak once during the period of for public comment. Discussion of any single item may be limited at the discretion of the Board President. The Board President may terminate remarks of any individual who does not adhere to established rules for public participation at Board meetings, who speaks in a threatening or profane manner, or who is otherwise unable to conduct him/herself in a civilized manner.[8] |
” |
| —Watertown Board of Education (January 27, 2014)[9] | ||
Budget
From 2010 to 2013, the Watertown Unified School District had an average of $48,195,750 in revenue and $53,137,750 in expenditures, according to the United States Census Bureau's survey of school system finances. The district had a yearly average of $26,394,000 in outstanding debt. The district retired $6,557,250 of its debt and issued $7,271,250 in new debt each year on average.[10]
Revenue
The table below separates the district's revenue into the three sources identified by the agency: local, state, and federal.
| Revenue by Source | |||||||||||
|---|---|---|---|---|---|---|---|---|---|---|---|
| Fiscal Year |
Local | State | Federal | Revenue Total | |||||||
| Total | % of Revenue | Total | % of Revenue | Total | % of Revenue | ||||||
| Click [show] on the right to display the revenue data for prior years. |
|---|
| 2010 | $20,034,000 | 41.70% | $23,237,000 | 48.37% | $4,773,000 | 9.93% | $48,044,000 |
| 2011 | $20,809,000 | 41.94% | $25,313,000 | 51.01% | $3,499,000 | 7.05% | $49,621,000 |
| 2012 | $20,985,000 | 44.14% | $22,902,000 | 48.17% | $3,658,000 | 7.69% | $47,545,000 |
| 2013 | $20,334,000 | 42.74% | $23,655,000 | 49.72% | $3,584,000 | 7.53% | $47,573,000 |
| Avg. | $20,540,500 | 42.63% | $23,776,750 | 49.32% | $3,878,500 | 8.05% | $48,195,750 |
Expenditures
The table below separates the district's expenditures into five categories identified by the agency:
- Instruction: operation expenditures, state payments on behalf of the district for instruction and benefits, and retirement system transfers
- Support Services: support services, food services, and retirement system transfers for support service staff
- Capital Spending: capital outlay expenditures (i.e., construction, land or facilities purchases, and equipment purchases)
- Debt & Gov. Payments: payments to state and local governments and interest on school system debt
- Other: all other non-K-12 programs, except food services
| Expenditures by Category | |||||||||||
|---|---|---|---|---|---|---|---|---|---|---|---|
| Fiscal Year |
Instruction | Support Services | Capital Spending | Debt & Gov. Payments | Other | Budget Total | |||||
| Total | % of Budget | Total | % of Budget | Total | % of Budget | Total | % of Budget | Total | % of Budget | ||
| Click [show] on the right to display the expenditure data for prior years. |
|---|
| 2010 | $25,468,000 | 40.71% | $17,452,000 | 27.90% | $17,160,000 | 27.43% | $655,000 | 1.05% | $1,824,000 | 2.92% | $62,559,000 |
| 2011 | $26,578,000 | 49.96% | $17,125,000 | 32.19% | $6,913,000 | 12.99% | $1,101,000 | 2.07% | $1,483,000 | 2.79% | $53,200,000 |
| 2012 | $25,260,000 | 54.51% | $16,529,000 | 35.67% | $1,866,000 | 4.03% | $1,094,000 | 2.36% | $1,594,000 | 3.44% | $46,343,000 |
| 2013 | $25,855,000 | 51.25% | $17,165,000 | 34.02% | $4,579,000 | 9.08% | $1,083,000 | 2.15% | $1,767,000 | 3.50% | $50,449,000 |
| Avg. | $25,790,250 | 49.11% | $17,067,750 | 32.44% | $7,629,500 | 13.38% | $983,250 | 1.91% | $1,667,000 | 3.16% | $53,137,750 |
Debt
The table below shows the amount of debt retired, issued, and outstanding in the district for each year.
| Debt | |||
|---|---|---|---|
| Fiscal Year |
Retired | Issued | Outstanding |
| Click [show] on the right to display the debt data for prior years. |
|---|
| 2010 | $21,579,000 | $21,356,000 | $24,536,000 |
| 2011 | $1,575,000 | $1,529,000 | $24,490,000 |
| 2012 | $1,755,000 | $6,200,000 | $28,935,000 |
| 2013 | $1,320,000 | $0 | $27,615,000 |
| Avg. | $6,557,250 | $7,271,250 | $26,394,000 |
Teacher salaries
The average teaching salary in the Watertown Unified School District during the 2015-2016 school year was $$57,866. The minimum salary was $$40,281, and the maximum salary was $$77,866, according to the Wisconsin Department of Public Instruction.[11]
Union
Teachers in the Watertown Unified School District are represented by Region 7 of the Wisconsin Education Association Council.[12]
Schools in the Watertown Unified School District
Enrollment
The Watertown Unified School District served 3,876 students in the 2014-2015 school year. Enrollment in the district decreased by 1.67 percent from 2009 to 2014.[13]
| Total enrollment | ||
|---|---|---|
| Year | Enrollment | Year-to-year change (%) |
| 2009-2010 | 3,942 | - |
| 2010-2011 | 3,951 | 0.23 |
| 2011-2012 | 3,889 | -1.59 |
| 2012-2013 | 3,844 | -1.71 |
| 2013-2014 | 3,864 | 0.52 |
| 2014-2015 | 3,876 | 0.31 |
District schools
The Watertown Unified School District operates nine schools, which are listed below in alphabetical order:[14]
| Watertown Unified School District |
|---|
| School Name |
| Douglas Elementary |
| Endeavor Charter School |
| Lebanon Elementary |
| Lincoln Elementary |
| Riverside Middle |
| Schurz Elementary |
| Watertown 4 Kids |
| Watertown High |
| Webster Elementary |
Academic performance
- See also: Public education in Wisconsin
The Wisconsin Department of Public Instruction administers annual Wisconsin Student Assessment System (WSAS) tests to students throughout the state. These tests assess proficiency in math and reading among students in grades three through eight as well as 10th grade. WSAS tests also evaluate proficiency in language arts, science, and social studies at grades four, eight, and 10. The Department of Public Instruction publishes results from WSAS tests as part of each district's Annual District Report Card.[15]
| Annual District Report Card grading scale[15] | |
|---|---|
| Designation | Score |
| Significantly Exceeds Expectations | 83-100 |
| Exceeds Expectations | 73-82.9 |
| Meets Expectations | 63-72.9 |
| Meets Few Expectations | 53-62.9 |
| Fails to Meet Expectations | 0-52.9 |
The Annual District Report Card compares district performance with state performance based on four criteria:[15]
- Student Achievement: This category compares reading and math performance by district students to state and national standards.
- Student Growth: This category compares year-to-year performance on reading and math sections in WSAS tests.
- Closing Gaps: This category compares test performance by low-performing groups in the district to similar cohorts across the state.
- On-Track and Postsecondary Readiness: This category uses benchmarks including graduation rate, attendance rate, English language arts achievement, and math achievement to assess college and career readiness.
Districts can receive grades from 0 to 100 on the annual district report card, with "Significantly Exceeds Expectations" as the highest designation for scores of 83 and above, and "Fails to Meet Expectations" as the lowest designation for scores of 52.9 and below. The full grading scale can be found in the table above.
The Watertown Unified School District achieved an overall score of 72.7 during the 2015-2016 school year, which led to a "Meets Expectations" designation from the Department of Public Instruction. The district achieved an overall score of 73.0 for the 2013-2014 school year, which led to an "Exceeds Expectations" designation, and an overall score of 68.4 for the 2012-2013 school year, which led to a "Meets Expectations" designation. The following tables compare district performance with state performance and detail the accountability ratings for schools in the district, according to the annual district report cards for the 2012-2013, 2013-2014, and 2015-2016 school years.[15]
| Annual district report cards were not published for the 2014-2015 school year. The Wisconsin State Legislature passed SB 67, known as the pause bill, in May 2015 to stop the Wisconsin Department of Public Instruction from publishing annual district report cards and using the results for educator effectiveness assessments for the 2014-2015 school year.[16] The bill was passed due to concerns about how results from new assessments based on the Common Core State Standards Initiative would be applied. It was supported by Wisconsin Superintendent of Public Instruction Tony Evers and the Department of Public Instruction.[17] |
| Annual District Report Card grades[15] | |||||||||
|---|---|---|---|---|---|---|---|---|---|
| School year | Student achievement | Student growth | Closing gaps | On-track and postsecondary readiness | Overall score | ||||
| District | State | District | State | District | State | District | State | ||
| 2012-2013 | 61.3 | 66.1 | 59.8 | 60.6 | 67.0 | 66.8 | 85.8 | 84.9 | 68.4 |
| 2013-2014 | 63.2 | 66.4 | 69.0 | 62.4 | 72.3 | 66.3 | 87.6 | 85.3 | 73.0 |
| 2014-2015 | N/A | N/A | N/A | N/A | N/A | N/A | N/A | N/A | N/A |
| 2015-2016 | 64.0 | 67.5 | 70.8 | 66.0 | 65.2 | 60.8 | 89.2 | 86.6 | 72.7 |
| Accountability ratings for schools in the district[15] | ||||||||||
|---|---|---|---|---|---|---|---|---|---|---|
| School year | Significantly exceeds expectations | Exceeds expectations | Meets expectations | Meets few expectations | Fails to meet expectations | |||||
| Number of schools | Percent of schools | Number of schools | Percent of schools | Number of schools | Percent of schools | Number of schools | Percent of schools | Number of schools | Percent of schools | |
| 2012-2013 | 1 | 14.3% | 0 | 0.0% | 5 | 71.4% | 0 | 0.0% | 0 | 0.0% |
| 2013-2014 | 0 | 0.0% | 2 | 28.6% | 4 | 57.1% | 0 | 0.0% | 0 | 0.0% |
| 2014-2015 | N/A | N/A | N/A | N/A | N/A | N/A | N/A | N/A | N/A | N/A |
| 2015-2016 | 2 | 25.0% | 2 | 25.0% | 2 | 25.0% | 0 | 0.0% | 0 | 0.0% |
Mathematics and reading proficiency
The state's Annual District Report Card includes a review of district and state proficiency information in mathematics and reading for the previous five years. In the 2015-2016 school year, the state changed reading to English language arts (ELA). This review includes data from the Wisconsin Knowledge and Concepts Examination (WKCE) and the Wisconsin Alternate Assessment for Students with Disabilities (WAA-SwD) for students from grades three through eight and 10. The following tables compare the district's percentage of proficient and advanced proficient students with state levels from the 2009-2010 school year through 2013-2014 school year as well as the 2015-2016 school year. The district's proficiency rates in math and reading and ELA increased since 2009.[15]
|
| ||||||||||||||||||||||||||||||||||||||||||||||||||||||
Graduation and dropout rates
The district's graduation rate has increased since 2009, and the district’s dropout rate has decreased since 2005. The tables below detail the district's four-year, five-year, and six-year cohort graduation rates from school year 2009-2010 to 2014-2015 and the district's dropout rates from school year 2005-2006 to 2014-2015.[18][19]
|
| ||||||||||||||||||||||||||||||||||||||||||||||||||||||||||||||||||||||||||||||||||||||||||||||||||
Contact information

Watertown Unified School District
111 Dodge St.
Watertown, WI 53094
Phone: (920) 262-1460
Fax: (920) 262-1469
See also
| Wisconsin | School Board Elections | News and Analysis |
|---|---|---|
 |
 | |
External links
- Watertown Unified School District
- City of Watertown
- Dodge County
- Jefferson County
- Wisconsin Department of Public Instruction
- Wisconsin Association of School Boards
- Region 7 of the Wisconsin Education Association Council
Footnotes
- ↑ U.S. Department of Education, National Center for Education Statistics, "Common Core of Data, file ccd_lea_052_1414_w_0216161a, 2014-2015," accessed November 16, 2016
- ↑ 2.0 2.1 2.2 2.3 2.4 United States Census Bureau, "Dodge County, Wisconsin," accessed December 19, 2016
- ↑ Watertown Unified School District, "Message from the Superintendent of Schools," accessed January 15, 2016
- ↑ LinkedIn, "Cassandra Schug," accessed July 7, 2016
- ↑ Post-Crescent, "Database: 2011-2016 Wisconsin teacher, principal, administrator salaries," accessed January 19, 2017
- ↑ 6.0 6.1 Watertown Unified School District, "Board Members," accessed January 15, 2016
- ↑ 7.0 7.1 7.2 Watertown Unified School District, "Board Agendas and Minutes," accessed March 7, 2018
- ↑ Note: This text is quoted verbatim from the original source. Any inconsistencies are attributable to the original source.
- ↑ Watertown Unified School District, "Board of Education Policy: Policy #8523," accessed January 15, 2016
- ↑ United States Census Bureau, "Public School System Finances: Historical Data," accessed December 1, 2015
- ↑ Wisconsin Department of Public Instruction, "School Staff: Salary, Position & Demographic Reports," accessed January 18, 2017
- ↑ Southeast United Public Educators Region 7 Wisconsin Education Association Council, "About Us," accessed January 15, 2016
- ↑ Wisconsin Information System for Education Data Dashboard, "Enrollment (Single Year): Watertown Unified," accessed January 18, 2017
- ↑ National Center for Education Statistics, "Search for Public Schools," accessed January 18, 2017
- ↑ 15.0 15.1 15.2 15.3 15.4 15.5 15.6 Wisconsin Department of Public Instruction, "Report Cards," accessed January 18, 2017
- ↑ Wisconsin Department of Public Instruction, "School Accountability for 2014-2015: Five Things You Need To Know," June 15, 2015
- ↑ Wisconsin Department of Public Instruction, "Superintendent Evers’ statement on Assembly passage of SB 67," May 13, 2015
- ↑ Cite error: Invalid
<ref>tag; no text was provided for refs namedgradrate - ↑ Wisconsin Department of Public Instruction, "Wisconsin Information System for Education Data Dashboard, Attendance-Dropouts (Single Year): Watertown Unified," accessed January 18, 2017
| |||||

