New Hampshire school board elections, 2015
| New Hampshire's 2015 elections School boards • Candidate ballot access |
2016 →
← 2014
|
Candidate filing dates • Finance reporting • Poll opening and closing times |
A total of two New Hampshire school districts among America's largest school districts by enrollment held elections for 19 seats on November 3, 2015.
Here are several quick facts about New Hampshire's school board elections in 2015:
- The largest school district by enrollment with an election in 2015 was Manchester School District with 14,452 K-12 students.
- The smallest school district by enrollment with an election in 2015 was Nashua School District with 11,791 K-12 students.
- Manchester School District had the most seats on the ballot in 2015 with 14 seats up for election.
- Nashua School District had the fewest seats on the ballot in 2015 with five seats up for election.
The districts listed below served 26,243 K-12 students during the 2012-2013 school year, according to the National Center for Education Statistics.[1] Click on the district names for more information on the district and its school board elections.
| 2015 New Hampshire School Board Elections | ||||
|---|---|---|---|---|
| District | Date | Seats up for election | Total board seats | Student enrollment |
| Manchester School District | 11/3/2015 | 14 | 15 | 14,452 |
| Nashua School District | 11/3/2015 | 5 | 9 | 11,791 |
Trends in New Hampshire school board elections
- See also: School boards in session: 2015 in brief
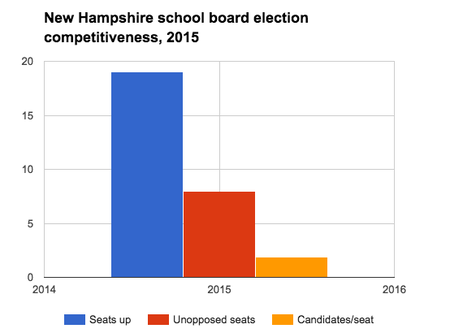 |
The 2015 school board elections in New Hampshire's largest school districts had a higher average number of candidates run per seat than school board elections held across the United States had in 2015; however, the school board elections in New Hampshire had a higher percentage of unopposed seats. Newcomers did not fair as well in New Hampshire's elections as they did in elections across the United States. They won 31.58 percent of seats in New Hampshire, while they took 40.77 percent of the seats nationwide.
The following sections analyze competitiveness and incumbency advantage in New Hampshire's school board elections. One of the two districts utilized primary elections. In the other district, winners only had to receive a plurality, or relative majority, of votes in the general election to secure a seat. All of the school board elections held in the state in 2015 were nonpartisan.
Details of the data discussed here can be found in the table below.
Competitiveness
In 2015, an average of 1.89 candidates ran per seat on the ballot in New Hampshire's school board elections. This was higher than the average 1.72 candidates who ran per seat in school board elections in the country's largest school districts in 2015. The rate of unopposed seats in New Hampshire was also higher compared to the percentage of seats that were unopposed in school board elections across the United States. A total of 42.11 percent of seats were unopposed in New Hampshire, while 35.97 percent of school board seats were unopposed nationwide.
Incumbency advantage
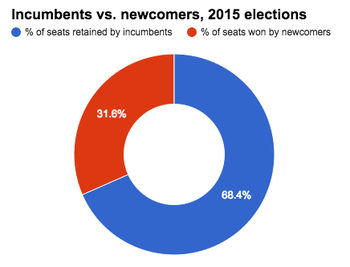
A total of 86.67 percent of incumbents who ran for re-election in New Hampshire's school board elections in 2015 successfully retained their seats. Fifteen out of the 19 incumbents whose seats were on the ballot ran for re-election, and 13 of them won. Six of those winners were unopposed; the other seven winners had to defeat challengers in order to keep their seats.
A total of 82.66 percent of incumbents kept their seats in school board elections across the country, and 40.45 percent of them ran unopposed. The map below details the success rates for incumbents who ran in the 2015 school board elections that were held in the largest school districts by enrollment in the U.S.
The map above details the success rates of incumbent who ran to retain their school board seats in the largest school districts in each state. States depicted in gray did not hold school board elections. |
Data table
The table below displays the statistics for school board elections in New Hampshire's largest school districts in 2015.
| New Hampshire school board elections, 2015 | ||||||||||
|---|---|---|---|---|---|---|---|---|---|---|
| Year | Total | Incumbents | ||||||||
| Seats up | Candidates | Candidates/ seat |
Unopposed seats | % unopposed | % seats won by newcomers | Sought re-election | Unopposed | Retained | % retained | |
| 2015 | 19 | 36 | 1.89 | 8 | 42.11% | 31.58% | 15 | 6 | 13 | 86.67% |
Survey responses
Two of the 36 candidates running for a school board seat in New Hampshire's largest school districts in the 2015 elections responded to Ballotpedia's school board candidate survey. The following sections display their answers to questions about top priorities and education issues.
Top priorities
When asked what his top priorities would be if elected, Jeremy Dobson, challenger for a seat on the Manchester Board of School Committee, stated:
| “ | Attracting and retaining top teachers so we can get Hooksett, Candia, and Auburn back to our high school.[2] | ” |
| —Jeremy Dobson, 2015[3] | ||
Ross Terrio, incumbent on the Manchester Board of School Committee, stated the following as his top priorities:
| “ | Redistricting. Overcrowded classrooms will be greatly reduced, in part, by coming up with a redistricting plan.[2] | ” |
| —Ross Terrio, 2015[4] | ||
Ranking the issues
The candidates were asked to rank the following issues by importance in the school district, with 1 being the most important and 7 being the least important. This table displays the candidates' average rankings as well as the highest and lowest rankings for each issue.
| Issue importance ranking | |||
|---|---|---|---|
| Issues | Average ranking | Highest ranking | Lowest ranking |
| Expanding arts education | 7.00 | 7 | 7 |
| Expanding career-technical education | 3.00 | 1 | 5 |
| Balancing or maintaining the district's budget | 4.50 | 3 | 6 |
| Improving college readiness | 2.50 | 2 | 3 |
| Closing the achievement gap | 4.00 | 4 | 4 |
| Improving education for special needs students | 3.50 | 2 | 5 |
| Expanding school choice options | 3.50 | 1 | 6 |
Positions on the issues
The candidates were asked an additional 10 short answer and multiple choice questions regarding significant issues in education. Links to those responses can be found below.
State profile
| Demographic data for New Hampshire | ||
|---|---|---|
| New Hampshire | U.S. | |
| Total population: | 1,330,111 | 316,515,021 |
| Land area (sq mi): | 8,953 | 3,531,905 |
| Race and ethnicity** | ||
| White: | 93.7% | 73.6% |
| Black/African American: | 1.3% | 12.6% |
| Asian: | 2.4% | 5.1% |
| Native American: | 0.2% | 0.8% |
| Pacific Islander: | 0% | 0.2% |
| Two or more: | 1.8% | 3% |
| Hispanic/Latino: | 3.2% | 17.1% |
| Education | ||
| High school graduation rate: | 92.3% | 86.7% |
| College graduation rate: | 34.9% | 29.8% |
| Income | ||
| Median household income: | $66,779 | $53,889 |
| Persons below poverty level: | 9.9% | 11.3% |
| Source: U.S. Census Bureau, "American Community Survey" (5-year estimates 2010-2015) Click here for more information on the 2020 census and here for more on its impact on the redistricting process in New Hampshire. **Note: Percentages for race and ethnicity may add up to more than 100 percent because respondents may report more than one race and the Hispanic/Latino ethnicity may be selected in conjunction with any race. Read more about race and ethnicity in the census here. | ||
Presidential voting pattern
New Hampshire voted for the Democratic candidate in six out of the seven presidential elections between 2000 and 2024.
Pivot Counties (2016)
Ballotpedia identified 206 counties that voted for Donald Trump (R) in 2016 after voting for Barack Obama (D) in 2008 and 2012. Collectively, Trump won these Pivot Counties by more than 580,000 votes. Of these 206 counties, three are located in New Hampshire, accounting for 1.46 percent of the total pivot counties.[5]
Pivot Counties (2020)
In 2020, Ballotpedia re-examined the 206 Pivot Counties to view their voting patterns following that year's presidential election. Ballotpedia defined those won by Trump won as Retained Pivot Counties and those won by Joe Biden (D) as Boomerang Pivot Counties. Nationwide, there were 181 Retained Pivot Counties and 25 Boomerang Pivot Counties. New Hampshire had one Retained Pivot County and two Boomerang Pivot Counties, accounting for 0.55 and 8.00 percent of all Retained and Boomerang Pivot Counties, respectively.
More New Hampshire coverage on Ballotpedia
- Elections in New Hampshire
- United States congressional delegations from New Hampshire
- Public policy in New Hampshire
- Endorsers in New Hampshire
- New Hampshire fact checks
- More...
Academic performance
| Education terms |
|---|
| For more information on education policy terms, see this article. |
- See also: Public education in New Hampshire
NAEP scores
- See also: NAEP scores by state
The National Center for Education Statistics provides state-by-state data on student achievement levels in mathematics and reading in the National Assessment of Educational Progress (NAEP). The chart below presents the percentage of fourth and eighth grade students that scored at or above proficient in reading and math during the 2012-2013 school year. Compared to three neighboring states (Maine, Massachusetts, and Vermont), New Hampshire had the highest percentage of fourth grade students score at or above proficient in math.[6]
| Percent of students scoring at or above proficient, 2012-2013 | ||||
|---|---|---|---|---|
| Math - Grade 4 | Math - Grade 8 | Reading - Grade 4 | Reading - Grade 8 | |
| New Hampshire | 59% | 47% | 45% | 44% |
| Maine | 47% | 40% | 37% | 38% |
| Massachusetts | 58% | 55% | 47% | 48% |
| Vermont | 52% | 47% | 42% | 45% |
| United States | 41% | 34% | 34% | 34% |
| Source: United States Department of Education, ED Data Express, "State Tables" | ||||
Graduation, ACT and SAT scores
The following table shows the graduation rates and average composite ACT and SAT scores for New Hampshire and surrounding states during the 2012-2013 school year. All statements made in this section refer to that school year.[6][7][8]
In the United States, public schools reported graduation rates that averaged to about 81.4 percent. About 54 percent of all students in the country took the ACT, while 50 percent reported taking the SAT. The average national composite scores for those tests were 20.9 out of a possible 36 for the ACT and 1,498 out of a possible 2,400 for the SAT.[9]
New Hampshire schools reported a graduation rate of 87.3 percent during the 2012-2013 school year, which was highest among its neighboring states.
In New Hampshire, more students took the SAT than the ACT in 2013, earning an average SAT score of 1,567.
| Comparison table for graduation rates and test scores, 2012-2013 | |||||||
|---|---|---|---|---|---|---|---|
| State | Graduation rate, 2013 | Average ACT composite, 2013 | Average SAT composite, 2013 | ||||
| Percent | Quintile ranking** | Score | Participation rate | Score | Participation rate | ||
| New Hampshire | 87.3% | First | 23.8 | 19% | 1,567 | 70% | |
| Maine | 86.4% | First | 23.5 | 8% | 1,380 | 95% | |
| Massachusetts | 85% | Second | 24.1 | 22% | 1,553 | 83% | |
| Vermont | 86.6% | First | 23 | 26% | 1,540 | 61% | |
| United States | 81.4% | 20.9 | 54% | 1498 | 50% | ||
| **Graduation rates for states in the first quintile ranked in the top 20 percent nationally. Similarly, graduation rates for states in the fifth quintile ranked in the bottom 20 percent nationally. Sources: United States Department of Education, "ED Data Express" ACT.org, "2013 ACT National and State Scores," The Commonwealth Foundation, "SAT scores by state, 2013" | |||||||
Dropout rate
- See also: Public high school dropout rates by state for a full comparison of dropout rates by group in all states
The high school event dropout rate indicates the proportion of students who were enrolled at some time during the school year and were expected to be enrolled in grades nine through 12 in the following school year but were not enrolled by October 1 of the following school year. Students who have graduated, transferred to another school, died, moved to another country, or who are out of school due to illness are not considered dropouts. The average public high school event dropout rate for the United States remained constant at 3.3 percent for both school year 2010–2011 and school year 2011–2012. The event dropout rate for New Hampshire was lower than the national average at 1.3 percent in the 2010-2011 school year, and 1.3 percent in the 2011-2012 school year.[10]
See also
| New Hampshire | School Boards | News and Analysis |
|---|---|---|
 |
 | |
|
Footnotes
- ↑ National Center for Education Statistics, "Elementary/Secondary Information System," accessed April 20, 2015
- ↑ 2.0 2.1 Note: This text is quoted verbatim from the original source. Any inconsistencies are attributable to the original source.
- ↑ Ballotpedia School Board Candidate Survey, 2015, "Jeremy Dobson Responses," October 14, 2015
- ↑ Ballotpedia School Board Candidate Survey, 2015, "Ross Terrio Responses," October 12, 2015
- ↑ The raw data for this study was provided by Dave Leip of Atlas of U.S. Presidential Elections.
- ↑ 6.0 6.1 United States Department of Education, ED Data Express, "State Tables," accessed May 13, 2014
- ↑ ACT, "2012 ACT National and State Scores," accessed May 13, 2014
- ↑ Commonwealth Foundation, "SAT Scores by State 2013," October 10, 2013
- ↑ StudyPoints, "What's a good SAT score or ACT score?" accessed June 7, 2015
- ↑ United States Department of Education, National Center for Education Statistics, "Common Core of Data (CCD), State Dropout and Graduation Rate Data File, School Year 2010-11, Provision Version 1a and School Year 2011-12, Preliminary Version 1a," accessed May 13, 2014
| |||||
