Arkansas school board elections, 2015
| Arkansas's 2015 elections School boards • Candidate ballot access |
2016 →
← 2014
|
Candidate filing dates • Finance reporting • Poll opening and closing times |
Regular elections for Arkansas school boards were held September 15, 2015. Six Arkansas school districts among America's largest school districts by enrollment held elections for 11 seats on that date.
Here are several quick facts about Arkansas's largest school district elections in 2015:
- The largest school district by enrollment with an election in 2015 was Springdale Public Schools with 20,741 K-12 students.
- The smallest school district by enrollment with an election in 2015 was Conway Public Schools with 9,829 K-12 students.
- Fort Smith Public Schools had the most seats on the ballot in 2015 with three seats up for election in both districts.
- Bentonville School District and Cabot Public School District tied for the fewest seats on the ballot in 2015 with two seats up for election in each district.
The districts listed below served 85,040 K-12 students during the 2012-2013 school year, according to the National Center for Education Statistics.[1] Click on the district names for more information on the district and its school board elections.
| 2015 Arkansas School Board Elections | ||||
|---|---|---|---|---|
| District | Date | Seats up for election | Total board seats | Student enrollment |
| Bentonville School District | 9/15/2015 | 1 | 7 | 14,880 |
| Cabot Public School District | 9/15/2015 | 1 | 7 | 10,423 |
| Conway Public Schools | 9/15/2015 | 2 | 7 | 9,829 |
| Fort Smith Public Schools | 9/15/2015 | 3 | 7 | 14,374 |
| Rogers School District | 9/15/2015 | 2 | 7 | 14,793 |
| Springdale Public Schools | 9/15/2015 | 2 | 7 | 20,741 |
Trends in Arkansas school board elections
- See also: School boards in session: 2015 in brief
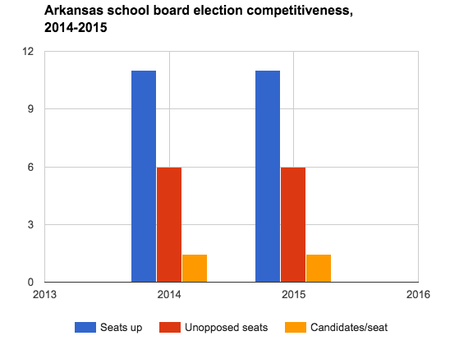
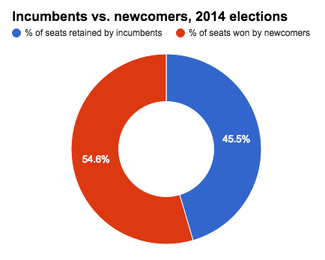
The 2015 school board elections held in Arkansas' largest school districts had the same number of seats on the ballot as the 2014 school board elections. The same number of candidates ran in each election, and the same number of seats were unopposed. The 2015 elections, however, saw fewer newcomers join school boards in the state. More incumbents ran for re-election in 2015 than in 2014, and they were also more successful in their bids for re-election.
The following sections analyze competitiveness and incumbency advantage in Arkansas' school board elections. These districts did not utilize primary or runoff elections. Winners only had to receive a plurality, or relative majority, of votes to secure a seat. All of the school board elections held in the state in 2014 and 2015 were nonpartisan.
Details of the data discussed here can be found in the table below.
Competitiveness
In 2015, school board elections in the state's largest school districts attracted an average of 1.45 candidates per seat. The 2014 school board elections also attracted an average of 1.45 candidates per seat. Eleven seats were on the ballot both years, and a total of 16 candidates filed to run both years. Six of the seats went unopposed each year as well.
Incumbency advantage
|
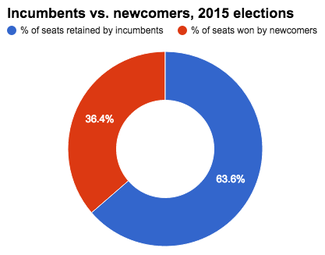
A total of 77.78 percent of incumbents who ran for re-election in 2015 retained their seats. This was higher than the 62.50 percent of incumbents who kept their seats in 2014. Nine incumbents ran for re-election in 2015, and seven of them were re-elected. Five of them won re-election unopposed, and two defeated challengers to keep their seats. In 2014, eight incumbents ran to retain their seats, and five of them won re-election. Three of the winners ran unopposed, and two defeated challengers to keep their seats. The map below details the success rates for incumbents who ran in the 2015 school board elections that were held in the largest school districts by enrollment in the U.S.
|
  |
Data table
The table below displays the statistics for school board elections in Arkansas' largest school districts from 2014 to 2015.
| Arkansas school board elections, 2014-2015 | ||||||||||
|---|---|---|---|---|---|---|---|---|---|---|
| Year | Total | Incumbents | ||||||||
| Seats up | Candidates | Candidates/ seat |
Unopposed seats | % unopposed | % seats won by newcomers | Sought re-election | Unopposed | Retained | % retained | |
| 2015 | 11 | 16 | 1.45 | 6 | 54.55% | 36.36% | 9 | 5 | 7 | 77.78% |
| 2014 | 11 | 16 | 1.45 | 6 | 54.55% | 54.55% | 8 | 3 | 5 | 62.50% |
Survey responses
One of the 16 candidates running for a school board seat in Arkansas' largest school districts in the 2015 elections responded to Ballotpedia's school board candidate survey. The following sections display the candidate's answers to questions about top priorities and education issues.
Top priorities
When asked what her top priorities would be if elected, Eowyn Francis-Moore, challenger in the Bentonville School District election, stated:

| “ | My top priorities are building a 12th elementary school in West Bella Vista with capacity of at least 700 using funds the district already has and without going back to the tax payers. I am committed to finding creative solutions for the district's over crowding challenges while only rezoning when new schools open. Another top priority is improving graduation rates and implementing programs for at-risk students.[2] | ” |
| —Eowyn Francis-Moore (2015)[3] | ||
Ranking the issues
Francis-Moore was asked to rank the following issues by importance in the school district, with 1 being the most important and 7 being the least important. This table displays her rankings:
| Issue importance ranking | |
|---|---|
| Candidate's ranking | Issue |
| Balancing or maintaining the district's budget | |
| Improving college readiness | |
| Expanding school choice options | |
| Improving education for special needs students | |
| Closing the achievement gap | |
| Expanding career-technical education | |
| Expanding arts education | |
Positions on the issues
Francis-Moore was asked an additional 10 short answer and multiple choice questions regarding significant issues in education. A link to those responses can be found below.
State profile
| Demographic data for Arkansas | ||
|---|---|---|
| Arkansas | U.S. | |
| Total population: | 2,977,853 | 316,515,021 |
| Land area (sq mi): | 52,035 | 3,531,905 |
| Race and ethnicity** | ||
| White: | 78% | 73.6% |
| Black/African American: | 15.5% | 12.6% |
| Asian: | 1.4% | 5.1% |
| Native American: | 0.6% | 0.8% |
| Pacific Islander: | 0.2% | 0.2% |
| Two or more: | 2.1% | 3% |
| Hispanic/Latino: | 6.9% | 17.1% |
| Education | ||
| High school graduation rate: | 84.8% | 86.7% |
| College graduation rate: | 21.1% | 29.8% |
| Income | ||
| Median household income: | $41,371 | $53,889 |
| Persons below poverty level: | 22.9% | 11.3% |
| Source: U.S. Census Bureau, "American Community Survey" (5-year estimates 2010-2015) Click here for more information on the 2020 census and here for more on its impact on the redistricting process in Arkansas. **Note: Percentages for race and ethnicity may add up to more than 100 percent because respondents may report more than one race and the Hispanic/Latino ethnicity may be selected in conjunction with any race. Read more about race and ethnicity in the census here. | ||
Presidential voting pattern
- See also: Presidential voting trends in Arkansas
Arkansas voted Republican in all seven presidential elections between 2000 and 2024.
Pivot Counties (2016)
Ballotpedia identified 206 counties that voted for Donald Trump (R) in 2016 after voting for Barack Obama (D) in 2008 and 2012. Collectively, Trump won these Pivot Counties by more than 580,000 votes. Of these 206 counties, one is located in Arkansas, accounting for 0.5 percent of the total pivot counties.[4]
Pivot Counties (2020)
In 2020, Ballotpedia re-examined the 206 Pivot Counties to view their voting patterns following that year's presidential election. Ballotpedia defined those won by Trump won as Retained Pivot Counties and those won by Joe Biden (D) as Boomerang Pivot Counties. Nationwide, there were 181 Retained Pivot Counties and 25 Boomerang Pivot Counties. Arkansas had one Retained Pivot County, 0.55 percent of all Retained Pivot Counties.
More Arkansas coverage on Ballotpedia
- Elections in Arkansas
- United States congressional delegations from Arkansas
- Public policy in Arkansas
- Endorsers in Arkansas
- Arkansas fact checks
- More...
Academic performance
- See also: Public education in Arkansas
| Education terms |
|---|
| For more information on education policy terms, see this article. |
NAEP scores
- See also: NAEP scores by state
The National Center for Education Statistics provides state-by-state data on student achievement levels in mathematics and reading in the National Assessment of Educational Progress (NAEP). Compared to three neighboring states (Louisiana, Mississippi, and Missouri) in the 2012-2013 academic year, Arkansas' fourth grade students scored the highest in mathematics (tying with Missouri).[5]
| Percent of students scoring at or above proficient, 2012-2013 | ||||
|---|---|---|---|---|
| Math - Grade 4 | Math - Grade 8 | Reading - Grade 4 | Reading - Grade 8 | |
| Arkansas | 39% | 28% | 32% | 30% |
| Louisiana | 26% | 21% | 23% | 24% |
| Mississippi | 26% | 21% | 21% | 20% |
| Missouri | 39% | 33% | 35% | 36% |
| U.S. averages | 41% | 34% | 34% | 34% |
| Source: United States Department of Education, ED Data Express, "State Tables," accessed May 13, 2014 | ||||
Graduation, ACT and SAT scores
The following table shows the graduation rates and average composite ACT and SAT scores for Arkansas and surrounding states during the 2012-2013 school year. All statements made in this section refer to that school year.[5][6][7]
In the United States, public schools reported graduation rates that averaged to about 81.4 percent. About 54 percent of all students in the country took the ACT, while 50 percent reported taking the SAT. The average national composite scores for those tests were 20.9 out of a possible 36 for the ACT and 1,498 out of a possible 2,400 for the SAT.[8]
Arkansas schools reported a graduation rate of 84.9 percent, which ranked higher than two of Arkansas' three neighboring states.
In Arkansas, more students took the ACT than the SAT. The students taking the ACT scored an average of 20.2.
| Comparison table for graduation rates and test scores, 2012-2013 | |||||||
|---|---|---|---|---|---|---|---|
| State | Graduation rate, 2013 | Average ACT composite, 2013 | Average SAT composite, 2013 | ||||
| Percent | Quintile ranking** | Score | Participation rate | Score | Participation rate | ||
| Arkansas | 84.9% | Second | 20.2 | 90% | 1,697 | 4% | |
| Louisiana | 73.5% | Fifth | 19.5 | 100% | 1,655 | 5% | |
| Mississippi | 75.5% | Fifth | 18.9 | 95% | 1,673 | 3% | |
| Missouri | 85.7% | Second | 21.6 | 74% | 1,773 | 4% | |
| United States | 81.4% | 20.9 | 54% | 1498 | 50% | ||
| **Graduation rates for states in the first quintile ranked in the top 20 percent nationally. Similarly, graduation rates for states in the fifth quintile ranked in the bottom 20 percent nationally. Sources: United States Department of Education, "ED Data Express," accessed May 28, 2015 ACT.org, "2013 ACT National and State Scores," accessed May 28, 2015 The Commonwealth Foundation, "SAT scores by state, 2013," accessed May 28, 2015 | |||||||
Dropout rate
- See also: Public high school dropout rates by state for a full comparison of dropout rates by group in all states
The high school event dropout rate indicates the proportion of students who were enrolled at some time during the school year and were expected to be enrolled in grades 9–12 in the following school year but were not enrolled by October 1 of the following school year. Students who have graduated, transferred to another school, died, moved to another country, or who are out of school due to illness are not considered dropouts. The average public high school event dropout rate for the United States remained constant at 3.3 percent for both SY 2010–11 and SY 2011–12. The event dropout rate for Arkansas was higher than the national average at 3.5 percent in the 2010-2011 school year. The dropout rate was lower than the national average at 3.2 percent in the 2011-2012 school year.[9]
See also
| Arkansas | School Boards | News and Analysis |
|---|---|---|
 |
 | |
Footnotes
- ↑ National Center for Education Statistics, "Elementary/Secondary Information System," accessed April 20, 2015
- ↑ Note: This text is quoted verbatim from the original source. Any inconsistencies are attributable to the original source.
- ↑ Ballotpedia School Board Candidate Survey, 2015, "Eowyn Francis-Moore's responses," August 26, 2015
- ↑ The raw data for this study was provided by Dave Leip of Atlas of U.S. Presidential Elections.
- ↑ 5.0 5.1 United States Department of Education, ED Data Express, "State Tables," accessed May 13, 2014
- ↑ ACT, "2012 ACT National and State Scores," accessed May 13, 2014
- ↑ Commonwealth Foundation, "SAT Scores by State 2013," October 10, 2013
- ↑ StudyPoints, "What's a good SAT score or ACT score?" accessed June 7, 2015
- ↑ United States Department of Education, National Center for Education Statistics, "Common Core of Data (CCD), State Dropout and Graduation Rate Data File, School Year 2010-11, Provision Version 1a and School Year 2011-12, Preliminary Version 1a," accessed May 13, 2014
| |||||

.jpg)