North Carolina school board elections, 2015
| North Carolina's 2015 elections School boards • Municipal • Candidate ballot access |
2016 →
← 2014
|
Candidate filing dates • Finance reporting • Poll opening and closing times |
A total of four North Carolina school districts among America's largest school districts by enrollment held elections for 16 seats in 2015. All of the districts held their elections on November 3, 2015.
Here are several quick facts about North Carolina's school board elections in 2015:
- The largest school district by enrollment with an election in 2015 was Charlotte-Mecklenburg Schools with 144,478 K-12 students.
- The smallest school district by enrollment with an election in 2015 was Chapel Hill-Carrboro City Schools with 12,329 K-12 students.
- Cleveland County Schools had the most seats on the ballot in 2015 with five seats up for election.
- Charlotte-Mecklenburg Schools had the fewest seats on the ballot in 2015 with three seats up for election.
The districts listed below served 186,101 K-12 students during the 2012-2013 school year, according to the National Center for Education Statistics.[1] Click on the district names for more information on the district and its school board elections.
| 2015 North Carolina School Board Elections | ||||
|---|---|---|---|---|
| District | Date | Seats up for election | Total board seats | Student enrollment |
| Burke County Public Schools | 11/3/2015 | 4 | 7 | 13,343 |
| Chapel Hill-Carrboro City Schools | 11/3/2015 | 4 | 7 | 12,329 |
| Charlotte-Mecklenburg Schools | 11/3/2015 | 3 | 9 | 144,478 |
| Cleveland County Schools | 11/3/2015 | 5 | 9 | 15,951 |
Trends in North Carolina school board elections
- See also: School boards in session: 2015 in brief
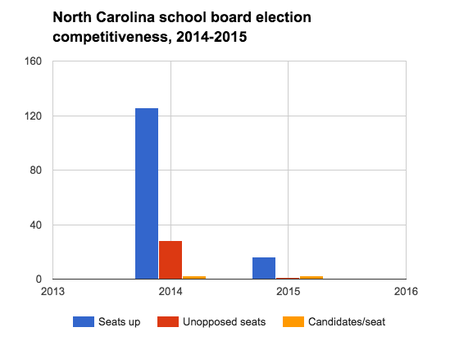
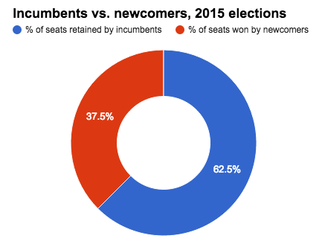
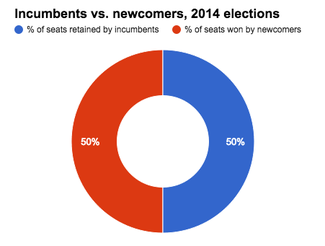
The 2015 school board elections in North Carolina's largest schools districts attracted a higher average number of candidates per seat on the ballot than the state's 2014 school board elections did. The 2015 elections also had a lower percentage of seats go unopposed than the 2014 elections had. Newcomers, however, fared better in the state's 2014 elections, taking 50.00 percent of the seats up for election. In 2015, newcomers won 37.50 percent of the seats on the ballot.
The 2015 elections had fewer seats on the ballot compared to the 2014 elections. Sixteen seats were on the ballot in 2015, whereas 126 seats were on the ballot in 2014.
The following sections analyze competitiveness and incumbency advantage in North Carolina's school board elections. These districts did not utilize primary or runoff elections. Winners only had to receive a plurality, or relative majority, of votes to secure a seat. All of the school board elections held in the state in 2014 and 2015 were nonpartisan.
Details of the data discussed here can be found in the table below.
Competitiveness
In 2015, elections held in North Carolina's largest school districts attracted an average of 2.56 candidates per seat up for election. This was higher than the average 2.17 candidates who ran per seat in the state's 2014 school board elections. In addition to having more candidates compete for each seat, the 2015 election saw a smaller percentage of unopposed seats. A total of 6.25 percent of the seats on the ballot in 2015 went unopposed, compared to the 22.22 percent that went unopposed in 2014.
Incumbency advantage
|
A total of 83.33 percent of the incumbents who ran for re-election in 2015 retained their seats. Twelve of the 16 incumbents whose terms were on the ballot ran to keep their seats, and 10 of them won. One of those winners was unopposed; the other nine winners defeated challengers to win additional terms. In 2014, 69.23 percent of incumbents who ran to retain their seats won re-election. A total of 91 out of the 126 incumbents whose terms were on the ballot ran to keep their seats, and 63 of them won. Nineteen of those winners ran unopposed; the other 54 defeated challengers to win their re-election bids. The map below details the success rates for incumbents who ran in the 2015 school board elections that were held in the largest school districts by enrollment in the U.S.
|
  |
Data table
The table below displays the statistics for school board elections in North Carolina's largest school districts from 2014 to 2015.
| North Carolina school board elections, 2014-2015 | ||||||||||
|---|---|---|---|---|---|---|---|---|---|---|
| Year | Total | Incumbents | ||||||||
| Seats up | Candidates | Candidates/ seat |
Unopposed seats | % unopposed | % seats won by newcomers | Sought re-election | Unopposed | Retained | % retained | |
| 2015 | 16 | 41 | 2.56 | 1 | 6.25% | 37.50% | 12 | 1 | 10 | 83.33% |
| 2014 | 126 | 273 | 2.17 | 28 | 22.22% | 50.00% | 91 | 19 | 63 | 69.23% |
Spotlight districts
Teacher turnover tripled in last five years
The North Carolina Department of Public Instruction released a report on teacher attrition in North Carolina that analyzed teacher turnover data from the years 2010 to 2015. The state saw triple the number of teachers leave the state compared to five years prior. In an effort to retain more teachers, the General Assembly of North Carolina approved a starting salary increase from $33,000 to $35,000 for new teachers. While North Carolina school districts saw some of the largest teacher salary increases in the country in 2015, districts like Charlotte-Mecklenburg still fell below the national average for teacher lifetime earnings when salaries were adjusted for cost of living. The report also showed an increase in teachers who left the profession entirely. In 2015, approximately 1,200 teachers reported leaving North Carolina school districts for a different profession. That number was 366 in 2010.[2]
Charlotte-Mecklenburg Schools
The Charlotte-Mecklenburg School District saw a teacher turnover rate of 16.5 percent in the 2014-2015 school year, compared to the state average of 14.8 percent. That was the highest rate for the district in 12 years. Over 48 percent of teachers cited "personal reasons" as their reason for leaving the district. The district had the 31st-highest turnover rate of the 115 school districts in North Carolina between 2010-2015. It also had the fourth-highest turnover rate of the 14 school districts in the Charlotte metropolitan area in 2015.[3][4]
 |
| The graph above displays the teacher turnover percent in 2015 for the ten largest schools by enrollment in North Carolina. The table below shows 2015 teacher attrition data for the 39 North Carolina schools that are included in the largest 1,000 schools by enrollment in the country. Click [show] on the right to expand the table.[4] |
| North Carolina teacher attrition full data, 2015 | ||||
|---|---|---|---|---|
| District name | Total teachers | Teachers leaving | Leaving with career status | Turnover percent |
| Alamance-Burlington Schools | 1,507 | 231 | 166 | 15.33 |
| Brunswick County Schools | 805 | 120 | 94 | 14.91 |
| Buncombe County Schools | 1,672 | 217 | 163 | 12.98 |
| Burke County Schools | 847 | 79 | 78 | 9.33 |
| Cabarrus County Schools | 1,895 | 264 | 206 | 13.93 |
| Caldwell County Schools | 838 | 63 | 52 | 7.52 |
| Catawba County Schools | 1,050 | 124 | 105 | 11.81 |
| Chapel Hill-Carrboro City Schools | 942 | 175 | 133 | 18.58 |
| Charlotte-Mecklenburg Schools | 8,609 | 1,420 | 858 | 16.49 |
| Cleveland County Schools | 1,115 | 144 | 117 | 12.91 |
| Craven County Schools | 948 | 167 | 115 | 17.62 |
| Cumberland County Schools | 3,650 | 641 | 483 | 17.56 |
| Davidson County Schools | 1,204 | 112 | 86 | 9.3 |
| Duplin County Schools | 643 | 92 | 62 | 14.31 |
| Durham Public Schools | 2,389 | 488 | 326 | 20.43 |
| Gaston County Schools | 1,906 | 247 | 190 | 12.96 |
| Guilford County Schools | 4,984 | 745 | 534 | 14.95 |
| Harnett County Schools | 1,370 | 266 | 158 | 19.42 |
| Henderson County Schools | 921 | 121 | 98 | 13.14 |
| Iredell-Statesville Schools | 1,300 | 191 | 155 | 14.69 |
| Johnston County Schools | 2,292 | 321 | 230 | 14.01 |
| Lee County Schools | 636 | 118 | 66 | 18.55 |
| Lenoir County Public Schools | 581 | 75 | 48 | 12.91 |
| Lincoln County Schools | 789 | 81 | 68 | 10.27 |
| Moore County Schools | 833 | 144 | 114 | 17.29 |
| Nash-Rocky Mount Schools | 947 | 174 | 128 | 18.37 |
| New Hanover County Schools | 1,686 | 212 | 176 | 12.57 |
| Onslow County Schools | 1,589 | 246 | 163 | 15.48 |
| Pitt County Schools | 1,638 | 286 | 196 | 17.46 |
| Public Schools of Robeson County | 1,511 | 240 | 162 | 15.88 |
| Randolph County Schools | 1,193 | 153 | 116 | 12.82 |
| Rockingham County Schools | 881 | 93 | 71 | 10.56 |
| Rowan-Salisbury Schools | 1,300 | 183 | 144 | 14.08 |
| Union County Public Schools | 2,567 | 401 | 312 | 15.62 |
| Wake County Schools | 10,144 | 1,355 | 1,057 | 13.36 |
| Wayne County Public Schools | 1,218 | 142 | 106 | 11.66 |
| Wilkes County Schools | 631 | 63 | 39 | 9.98 |
| Wilson County Schools | 747 | 124 | 88 | 16.6 |
| Winston-Salem/Forsyth Schools | 3,826 | 472 | 364 | 12.34 |
Survey responses
Three of the 41 candidates running for a school board seat in North Carolina's largest school districts in the 2015 elections responded to Ballotpedia's school board candidate survey. The following sections display their answers to questions about top priorities and education issues.
Top priorities

When asked what her top priorities would be if elected, Rani Dasi, winner of a seat on the Chapel Hill-Carrboro City Schools Board of Education, stated:
| “ | Improving educational outcomes for all students via:
|
” |
| —Rani Dasi (2015)[6] | ||

Pat Heinrich, winner of a seat on the Chapel Hill-Carrboro City Schools Board of Education, said the following were his top priorities:
| “ | Developing a comprehensive plan to address the achievement gap given the resource constraints of our schools [5] | ” |
| —Pat Heinrich (2015)[7] | ||

When asked what her top priorities would be if elected, Janeen Bryant, challenger for a seat on the Charlotte-Mecklenburg Schools Board of Education, stated:
| “ | My top priority if elected for school board is to support teachers and empowering their voice. I also want to also focus on the search for superintendent and the process for student assignment guidelines.[5] | ” |
| —Janeen Bryant (2015)[7] | ||
Ranking the issues
The candidates were asked to rank the following issues by importance in the school district, with 1 being the most important and 7 being the least important. This table displays the candidates' average rankings as well as the highest and lowest rankings for each issue.
| Issue importance ranking | |||
|---|---|---|---|
| Issues | Average ranking | Highest ranking | Lowest ranking |
| Expanding arts education | 4.00 | 2 | 6 |
| Expanding career-technical education | 4.33 | 3 | 5 |
| Balancing or maintaining the district's budget | 3.67 | 1 | 7 |
| Improving college readiness | 3.33 | 2 | 5 |
| Closing the achievement gap | 3.00 | 1 | 6 |
| Improving education for special needs students | 4.67 | 4 | 6 |
| Expanding school choice options | 5.00 | 1 | 7 |
Positions on the issues
The candidates were asked an additional 10 short answer and multiple choice questions regarding significant issues in education. Links to those responses can be found below.
State profile
| Demographic data for North Carolina | ||
|---|---|---|
| North Carolina | U.S. | |
| Total population: | 10,035,186 | 316,515,021 |
| Land area (sq mi): | 48,618 | 3,531,905 |
| Race and ethnicity** | ||
| White: | 69.5% | 73.6% |
| Black/African American: | 21.5% | 12.6% |
| Asian: | 2.5% | 5.1% |
| Native American: | 1.2% | 0.8% |
| Pacific Islander: | 0.1% | 0.2% |
| Two or more: | 2.4% | 3% |
| Hispanic/Latino: | 8.8% | 17.1% |
| Education | ||
| High school graduation rate: | 85.8% | 86.7% |
| College graduation rate: | 28.4% | 29.8% |
| Income | ||
| Median household income: | $46,868 | $53,889 |
| Persons below poverty level: | 20.5% | 11.3% |
| Source: U.S. Census Bureau, "American Community Survey" (5-year estimates 2010-2015) Click here for more information on the 2020 census and here for more on its impact on the redistricting process in North Carolina. **Note: Percentages for race and ethnicity may add up to more than 100 percent because respondents may report more than one race and the Hispanic/Latino ethnicity may be selected in conjunction with any race. Read more about race and ethnicity in the census here. | ||
Presidential voting pattern
North Carolina voted Republican in six out of the seven presidential elections between 2000 and 2024.
Pivot Counties (2016)
Ballotpedia identified 206 counties that voted for Donald Trump (R) in 2016 after voting for Barack Obama (D) in 2008 and 2012. Collectively, Trump won these Pivot Counties by more than 580,000 votes. Of these 206 counties, six are located in North Carolina, accounting for 2.91 percent of the total pivot counties.[8]
Pivot Counties (2020)
In 2020, Ballotpedia re-examined the 206 Pivot Counties to view their voting patterns following that year's presidential election. Ballotpedia defined those won by Trump won as Retained Pivot Counties and those won by Joe Biden (D) as Boomerang Pivot Counties. Nationwide, there were 181 Retained Pivot Counties and 25 Boomerang Pivot Counties. North Carolina had six Retained Pivot Counties, 3.31 percent of all Retained Pivot Counties.
More North Carolina coverage on Ballotpedia
- Elections in North Carolina
- United States congressional delegations from North Carolina
- Public policy in North Carolina
- Endorsers in North Carolina
- North Carolina fact checks
- More...
Academic performance
| Education terms |
|---|
| For more information on education policy terms, see this article. |
- See also: Public education in North Carolina
NAEP scores
- See also: NAEP scores by state
The National Center for Education Statistics provides state-by-state data on student achievement levels in mathematics and reading in the National Assessment of Educational Progress (NAEP). The chart below presents the percentage of fourth and eighth grade students that scored at or above proficient in reading and math during the 2012-2013 school year. Students in North Carolina generally scored higher than those in South Carolina and Tennessee, but lower than those in Virginia. The best scores in the state were earned by fourth graders in math, with 45 percent scoring at or above proficient.[9]
| Percent of students scoring at or above proficient, 2012-2013 | ||||
|---|---|---|---|---|
| Math - Grade 4 | Math - Grade 8 | Reading - Grade 4 | Reading - Grade 8 | |
| North Carolina | 45% | 36% | 35% | 33% |
| South Carolina | 35% | 31% | 28% | 29% |
| Tennessee | 40% | 28% | 34% | 33% |
| Virginia | 47% | 38% | 43% | 36% |
| United States | 41% | 34% | 34% | 34% |
| Source: United States Department of Education, ED Data Express, "State Tables" | ||||
| NAEP assessment data for all students, 2012-2013 |
|---|
Graduation, ACT and SAT scores
The following table shows the graduation rates and average composite ACT and SAT scores for North Carolina and surrounding states during the 2012-2013 school year. All statements made in this section refer to that school year.[9][10][11]
In the United States, public schools reported graduation rates that averaged to about 81.4 percent. About 54 percent of all students in the country took the ACT, while 50 percent reported taking the SAT. The average national composite scores for those tests were 20.9 out of a possible 36 for the ACT and 1,498 out of a possible 2,400 for the SAT.[12]
North Carolina schools reported a graduation rate of 82.5 percent during the 2012-2013 school year, which was the second-lowest rate among its neighboring states.
In North Carolina, more students took the ACT than the SAT in 2013, earning an average ACT score of 18.7.
| Comparison table for graduation rates and test scores, 2012-2013 | |||||||
|---|---|---|---|---|---|---|---|
| State | Graduation rate, 2013 | Average ACT composite, 2013 | Average SAT composite, 2013 | ||||
| Percent | Quintile ranking** | Score | Participation rate | Score | Participation rate | ||
| North Carolina | 82.5% | Third | 18.7 | 100% | 1,479 | 62% | |
| South Carolina | 77.6% | Fourth | 20.4 | 51% | 1,436 | 64% | |
| Tennessee | 86.3% | Second | 19.5 | 100% | 1,709 | 8% | |
| Virginia | 84.5% | Third | 22.6 | 26% | 1,528 | 71% | |
| U.S. averages | 81.4% | 20.9 | 54% | 1,498 | 50% | ||
| **Graduation rates for states in the first quintile ranked in the top 20 percent nationally. Similarly, graduation rates for states in the fifth quintile ranked in the bottom 20 percent nationally. Sources: United States Department of Education, "ED Data Express" ACT.org, "2013 ACT National and State Scores" The Commonwealth Foundation, "SAT scores by state, 2013" | |||||||
Dropout rate
- See also: Public high school dropout rates by state for a full comparison of dropout rates by group in all states
The high school event dropout rate indicates the proportion of students who were enrolled at some time during the school year and were expected to be enrolled in grades 9–12 in the following school year but were not enrolled by October 1 of the following school year. Students who have graduated, transferred to another school, died, moved to another country, or who are out of school due to illness are not considered dropouts. The average public high school event dropout rate for the United States remained constant at 3.3 percent for both school year 2010–11 and school year 2011–12. The event dropout rate for North Carolina was higher than the national average at 3.9 percent in the 2010-2011 school year, and lower than the national average at 3.1 percent in the 2011-2012 school year.[13]
See also
| North Carolina | School Boards | News and Analysis |
|---|---|---|
 |
 | |
Footnotes
- ↑ National Center for Education Statistics, "Elementary/Secondary Information System," accessed April 20, 2015
- ↑ North Carolina Public Radio, WUNC, "More Teachers Leave North Carolina To Teach In Other States," October 2, 2015
- ↑ Charlotte Observer, "CMS teacher turnover hits 16.5 percent, a 12-year high," October 1, 2015
- ↑ 4.0 4.1 North Carolina Department of Public Instruction, "2014-2015 Annual Report on Teachers Leaving the Profession, S.B. 333 Teacher Attrition Data," accessed October 5, 2015
- ↑ 5.0 5.1 5.2 Note: This text is quoted verbatim from the original source. Any inconsistencies are attributable to the original source.
- ↑ Ballotpedia School Board Candidate Survey, 2015, "Rani Dasi responses," July 31, 2015
- ↑ 7.0 7.1 Ballotpedia School Board Candidate Survey, 2015, "Pat Heinrich's responses," September 21, 2015 Cite error: Invalid
<ref>tag; name "BPsurvey" defined multiple times with different content - ↑ The raw data for this study was provided by Dave Leip of Atlas of U.S. Presidential Elections.
- ↑ 9.0 9.1 United States Department of Education, ED Data Express, "State Tables," accessed May 13, 2014
- ↑ ACT, "2012 ACT National and State Scores," accessed May 13, 2014
- ↑ Commonwealth Foundation, "SAT Scores by State 2013," October 10, 2013
- ↑ StudyPoints, "What's a good SAT score or ACT score?" accessed June 7, 2015
- ↑ United States Department of Education, National Center for Education Statistics, "Common Core of Data (CCD), State Dropout and Graduation Rate Data File, School Year 2010-11, Provision Version 1a and School Year 2011-12, Preliminary Version 1a," accessed May 13, 2014
| |||||
| |||||||||||||||||||||||
