New Jersey school board elections, 2015
| New Jersey's 2015 elections General Assembly • School boards • Candidate ballot access |
2016 →
← 2014
|
Candidate filing dates • Finance reporting • Poll opening and closing times |
A total of 18 New Jersey school districts among America's largest school districts by enrollment held elections for 58 seats in 2015. Two districts held elections on April 21, 2015, and the remaining 16 districts held their elections on November 3, 2015.
Here are several quick facts about New Jersey's school board elections in 2015:
- The largest school district by enrollment with an election in 2015 was Newark Public Schools with 35,588 K-12 students.
- The smallest school district by enrollment with an election in 2015 was Jackson School District with 9,224 K-12 students.
- Four districts tied for the largest number of seats on the ballot in 2015 with four seats up for election each.
The districts listed below served 274,059 K-12 students during the 2012-2013 school year, according to the National Center for Education Statistics.[1] Click on the district names for more information on the district and its school board elections.
Trends in New Jersey school board elections
- See also: School boards in session: 2015 in brief
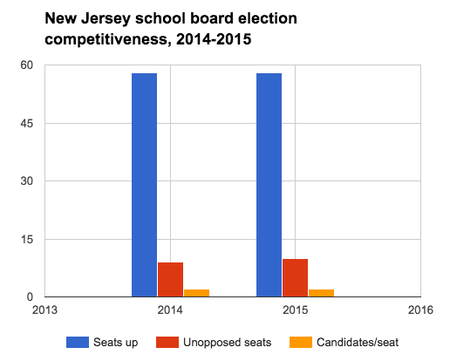
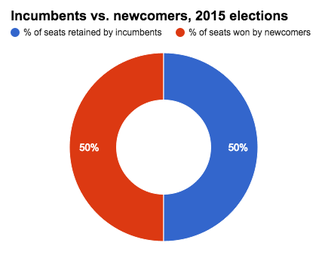
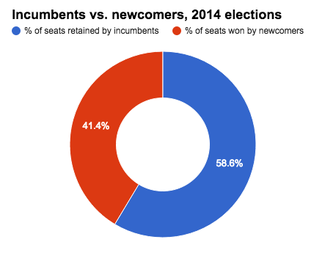
The 2015 school board elections in New Jersey's largest school districts had a similar average number of candidates run per seat as the average number who ran per seat in the state's 2014 school board elections. The 2015 elections had a slightly higher percentage of unopposed seats, compared to the percentage that were unopposed in 2014. Newcomers fared better in 2015 than in 2014. They won 50 percent of the seats up for election in 2015; in 2014, they won 41.38 percent of the seats on the ballot.
The following sections analyze competitiveness and incumbency advantage in New Jersey's school board elections. These districts did not utilize primary or runoff elections. Winners only had to receive a plurality, or relative majority, of votes to secure a seat. All of the school board elections held in the state in 2014 and 2015 were nonpartisan.
Details of the data discussed here can be found in the table below.
Competitiveness
In 2015, school board elections held in New Jersey's largest school districts attracted an average of 1.97 candidates per seat on the ballot. The 2014 elections had an average of two candidates run per seat up for election. In 2015, 10 of the 58 seats on the ballot were unopposed, a total of 17.24 percent. The 2014 elections had nine of the 58 seats go unopposed, a total of 15.52 percent.
Incumbency advantage
|
A total of 70.73 percent of school board incumbents who ran for re-election in 2015 retained their seats. Forty-one of the 58 incumbents whose terms were on the ballot ran to keep their seats, and 29 of them won. Eight of those winners ran unopposed; the other 21 defeated challengers to win additional terms. In 2014, 79.07 percent of incumbents who ran to retain their seats won re-election. A total of 43 of the 58 incumbents whose seats were on the ballot ran to keep their seats, and 34 of them won. Six of those winners ran unopposed; the others had to defeat challengers to win re-election. The map below details the success rates for incumbents who ran in the 2015 school board elections that were held in the largest school districts by enrollment in the U.S.
|
  |
Data table
The table below displays the statistics for school board elections in New Jersey's largest school districts from 2014 to 2015.
| New Jersey school board elections, 2014-2015 | ||||||||||
|---|---|---|---|---|---|---|---|---|---|---|
| Year | Total | Incumbents | ||||||||
| Seats up | Candidates | Candidates/ seat |
Unopposed seats | % unopposed | % seats won by newcomers | Sought re-election | Unopposed | Retained | % retained | |
| 2015 | 58 | 114 | 1.97 | 10 | 17.24% | 50.00% | 41 | 8 | 29 | 70.73% |
| 2014 | 58 | 116 | 2.00 | 9 | 15.52% | 41.38% | 43 | 6 | 34 | 79.07% |
Spotlight districts
Citizens in some New Jersey school districts expressed disappointment in their district leadership in the months prior to the elections on November 3, 2015. In the Hamilton Township School District, parents expressed frustration that nearly all of the school district's playgrounds had been closed due to safety concerns.[2] In Jersey City Public Schools, a group of Muslim community members were denied their petition to have the holiday of Eid al-Adha included in the school district calendar as a day off for students.[3] The race for four seats on the Clifton Board of Education centered on a debate over the board's efforts to implement a school uniform policy at elementary schools.[4]
Hamilton Township School District
Playgrounds closed over safety concerns
The Hamilton Township School District shut down the playgrounds at 15 of its 17 elementary schools in September 2015 after "hazardous conditions" were discovered by an inspector. The conditions included lack of safety surfaces, lack of wheelchair access and dangerous wear and tear, such as cracked slides, protruding bolts, rust, stressed panels and worn parts.[5]
The district initially closed all 17 elementary school playgrounds after the first inspection report came in, but the playgrounds at University Heights and Wilson elementary schools had been installed only a year previously and were deemed safe. The other 15 will remain closed until final reports deem them safe or repairs can be made.[6] “No one wants to put a child on a playground that has equipment that could cause serious harm to a child,” said Interim Superintendent Thomas Ficarra.[2]
The mayor of Hamilton Township offered to help the district get the playgrounds up to safety codes. The township was in charge of maintaining school playgrounds until 2012, when the school district's insurance provider insisted the equipment be approved by a manufacturer, distributor or approved contractor, according to NJ.com. At that time, the district and the city agreed that the district would take over the responsibility of maintaining them.[6]
Prior to the 2015-2016 school year, Ficarra had repairs made to the playgrounds, but the reports revealed that those repairs had not been enough. At a playground safety presentation on September 28, 2015, Ficarra admitted the district had not been monitoring the playgrounds as it should have. He said that going forward the district “will have someone inspecting these playgrounds on a daily basis.” Ficarra asked the board to approve the withdrawal of $250,000 from the district's maintenance reserve fund in order to pay for the needed updates and repairs.[2]
Jersey City Public Schools
After deliberation, Islamic holiday not added to calendar
After four hours of debate, the Jersey City Board of Education decided not to add the Islamic holiday of Eid al-Adha to the school's calendar in a split vote on September 17, 2015. The vote came after Muslim community members started circulating a petition in June 2015 that said it was discriminatory to not offer Muslim holidays. On September 10, 2015, the city council voted to include both Eid Al-Adha as well as the Hindu holiday of Diwali as city holidays. The school board, however, ultimately decided not to include Eid al-Adha, which occurred on September 24, 2015, on the 2015-2016 district calendar. They were concerned parents would not be able to find childcare on such short notice.[7][8][3]
"Doing this at this point on six days notice for this upcoming holiday is going to cause undue hardship on 5,000 to 10,000 people who are going to have to scramble to get coverage for their children," Board Member Gerald Lyons said.[3]
Despite voting down the new holiday, Jersey City Superintendent Marcia Lyles said the board "expressed a commitment to pursuing ways to demonstrate how much we respect all of our cultures."[7] She added:
| “ | I believe the discussion re-affirmed our commitment to recognizing and honoring the rich cultural and religious diversity of the Jersey City community. As I stated following the public voices, no matter how the Board ultimately voted, we will continue to engage the entire Jersey City community in this important conversation.[9] | ” |
| —Jersey City Superintendent Marcia Lyles (2015)[7] | ||
During the debate at the school board meeting, some Jewish community members expressed feelings of discrimination since the holidays of Rosh Hashanah and Yom Kippur were also not included in the school calendar. After voting against including the Muslim holiday, the board reminded those at the meeting that students were allowed skip school for religious reasons without any penalty. They also said they would revisit the school district's holiday policy again at a later date.[3]
Clifton Public Schools
School uniform policy debate
District residents and the Clifton Board of Education clashed over the creation of a school uniform policy throughout 2015. The district attempted to create school uniform policies in 2009 and 2012 but failed due to criticisms during public hearings. A proposal to require elementary school students to wear school uniforms was advanced in April 2015. Board members and school officials received a survey that month requesting input into the proposal, with parents receiving the survey later in the month. According to the Clifton Journal, the district reported 77 percent approval for school uniforms from respondents.[4]
Board President Gary Passenti appointed board members Rosemary Pino, Arlene Agresti and Judith A. Bassford to a uniform subcommittee on April 24, 2015. The board held forums required by state law on May 11 and May 18, 2015. The district contracted with Cleary, Giacobbe, Alfieri & Jacobs to provide legal advice including consultations on the uniform policy in June 2015. Tafari Anderson argued during an August 19 meeting that the district paid at least $20,000 in legal fees. The Clifton Journal reviewed invoices made available through public records requests and found at least $9,000 in fees related to the board's uniform policy discussion.[4]

By June 2015, the district passed a three-month notification deadline required by state law. State statute 18A:11-8 requires district officials to notify parents or guardians of students about uniform policies at least three months prior to the first day of the school year.[10] The uniform subcommittee and the board as a whole continued discussion of future uniform policy implementation. These discussions drew vocal opposition from a community group called Clifton Asserting Parental Rights (C.A.P.R.). This group opposed implementation of a uniform policy for several reasons, including the need for subsidies to help low-income families buy uniforms and the lack of an opt-out feature in the policy. C.A.P.R. also suggested that the policy would be difficult to change or eliminate once implemented. The group and other opponents argued that the proposal would break state law by applying school uniform requirements across all elementary schools rather than in a single school.[4][11]
The board voted 5-4 to eliminate the uniform subcommittee on September 16, 2015. Anderson and Michael Evans sought to eliminate the subcommittee in May 2015, but that vote failed 5-3. Anderson, Evans, Judith A. Bassford, Lucy Danny and John Houston voted to disband the committee. Bassford, who served on the committee until June 2015, argued that the committee wasted money. The other members spoke about the board's lack of transparency on the issue and the use of taxpayer money. James Daley opposed dismantling the committee because there was a large group of residents supportive of uniforms, while Passenti cited the likelihood of future discussions in defending the committee.[12]
| Candidate | Stance |
|---|---|
| James Daley | |
| Lawrence Grasso | |
| Bharat Rana | |
| Tafari Anderson | |
| Latasha Casterlow-Lalla | |
| Michael Evans | |
| John Houston | |
| Jaime Placek |
Candidate positions on uniform policy
A forum on October 5, 2015, exposed the differences among school board candidates about the district's efforts toward a uniform policy. The forum held at Clifton High School featured a lengthy discussion about the policy and the board's approach to implementation. Incumbents Anderson, Evans and Houston along with challengers Latasha Casterlow-Lalla and Jaime Placek expressed opposition to the school uniform policy. Casterlow-Lalla did not see the need for uniforms in the district and argued for an opt-out for parents, while Placek criticized the plan along with the board's approach to developing the policy.[13]
Daley held off on opposing the uniform policy until the board developed a draft plan for review. Lawrence Grasso echoed Daley's caution but also suggested that the policy was not under consideration because of specific incidents at elementary schools. Bharat Rana expressed a willingness to review a proposed uniform policy but wanted to shift the discussion to academic issues. The table to the right details the willingness of board candidates to support a school uniform policy similar to the policy proposed in 2015.[13]
Survey responses
Three of the 117 candidates running for a school board seat in New Jersey's largest school districts in the 2015 elections responded to Ballotpedia's school board candidate survey. The following sections display their answers to questions about top priorities and education issues.
Top priorities
The top priorities for Hollie Gilroy, challenger for a seat on the Edison Township Public Schools Board of Education, were:
| “ | Forging better parent, stakeholder and school relations.[9] | ” |
| —Hollie Gilroy (2015)[14] | ||
When asked what his top priorities would be if elected, Albert Gayzik, a former incumbent on the Hamilton Township School District Board of Education, stated:
| “ | Continue to work on curriculum and K-3 program[9] | ” |
| —Albert Gayzik (2015)[15] | ||
Andy Nicholes, challenger for a seat on the Middletown Township School District Board of Education, did not answer the question about top priorities.
Ranking the issues
The candidates were asked to rank the following issues by importance in the school district, with 1 being the most important and 7 being the least important. This table displays the candidates' average rankings as well as the highest and lowest rankings for each issue.
| Issue importance ranking | |||
|---|---|---|---|
| Issues | Average ranking | Highest ranking | Lowest ranking |
| Expanding arts education | 2.67 | 1 | 4 |
| Expanding career-technical education | 3.33 | 2 | 6 |
| Balancing or maintaining the district's budget | 3.33 | 1 | 6 |
| Improving college readiness | 5.00 | 4 | 6 |
| Closing the achievement gap | 5.33 | 4 | 7 |
| Improving education for special needs students | 4.67 | 2 | 7 |
| Expanding school choice options | 3.67 | 1 | 7 |
Positions on the issues
The candidates were asked an additional 10 short answer and multiple choice questions regarding significant issues in education. Links to those responses can be found below.
- Hollie Gilroy survey responses
- Albert Gayzik survey responses
- Andy Nicholes survey responses
State profile
| Demographic data for New Jersey | ||
|---|---|---|
| New Jersey | U.S. | |
| Total population: | 8,935,421 | 316,515,021 |
| Land area (sq mi): | 7,354 | 3,531,905 |
| Race and ethnicity** | ||
| White: | 68.3% | 73.6% |
| Black/African American: | 13.5% | 12.6% |
| Asian: | 9% | 5.1% |
| Native American: | 0.2% | 0.8% |
| Pacific Islander: | 0% | 0.2% |
| Two or more: | 2.5% | 3% |
| Hispanic/Latino: | 19% | 17.1% |
| Education | ||
| High school graduation rate: | 88.6% | 86.7% |
| College graduation rate: | 36.8% | 29.8% |
| Income | ||
| Median household income: | $72,093 | $53,889 |
| Persons below poverty level: | 12.7% | 11.3% |
| Source: U.S. Census Bureau, "American Community Survey" (5-year estimates 2010-2015) Click here for more information on the 2020 census and here for more on its impact on the redistricting process in New Jersey. **Note: Percentages for race and ethnicity may add up to more than 100 percent because respondents may report more than one race and the Hispanic/Latino ethnicity may be selected in conjunction with any race. Read more about race and ethnicity in the census here. | ||
Presidential voting pattern
- See also: Presidential voting trends in New Jersey
New Jersey voted for the Democratic candidate in all seven presidential elections between 2000 and 2024.
Pivot Counties (2016)
Ballotpedia identified 206 counties that voted for Donald Trump (R) in 2016 after voting for Barack Obama (D) in 2008 and 2012. Collectively, Trump won these Pivot Counties by more than 580,000 votes. Of these 206 counties, two are located in New Jersey, accounting for 0.97 percent of the total pivot counties.[16]
Pivot Counties (2020)
In 2020, Ballotpedia re-examined the 206 Pivot Counties to view their voting patterns following that year's presidential election. Ballotpedia defined those won by Trump won as Retained Pivot Counties and those won by Joe Biden (D) as Boomerang Pivot Counties. Nationwide, there were 181 Retained Pivot Counties and 25 Boomerang Pivot Counties. New Jersey had one Retained Pivot County and one Boomerang Pivot County, accounting for 0.55 and 4.00 percent of all Retained and Boomerang Pivot Counties, respectively.
More New Jersey coverage on Ballotpedia
- Elections in New Jersey
- United States congressional delegations from New Jersey
- Public policy in New Jersey
- Endorsers in New Jersey
- New Jersey fact checks
- More...
Academic performance
| Education terms |
|---|
| For more information on education policy terms, see this article. |
- See also: Public education in New Jersey
NAEP scores
- See also: NAEP scores by state
The National Center for Education Statistics provides state-by-state data on student achievement levels in mathematics and reading in the National Assessment of Educational Progress (NAEP). The chart below presents the percentage of fourth and eighth grade students that scored at or above proficient in reading and math during the 2012-2013 school year. Compared to three neighboring states (Delaware, New York, and Pennsylvania), New Jersey had the highest percentage of students scoring at or above proficient in all categories.[17]
| Percent of students scoring at or above proficient, 2012-2013 | ||||
|---|---|---|---|---|
| Math - Grade 4 | Math - Grade 8 | Reading - Grade 4 | Reading - Grade 8 | |
| New Jersey | 49% | 49% | 42% | 46% |
| Delaware | 42% | 33% | 38% | 33% |
| New York | 40% | 32% | 37% | 35% |
| Pennsylvania | 44% | 42% | 40% | 42% |
| United States | 41% | 34% | 34% | 34% |
| Source: United States Department of Education, ED Data Express, "State Tables" | ||||
Graduation, ACT and SAT scores
The following table shows the graduation rates and average composite ACT and SAT scores for New Jersey and surrounding states during the 2012-2013 school year. All statements made in this section refer to that school year.[17][18][19]
In the United States, public schools reported graduation rates that averaged to about 81.4 percent. About 54 percent of all students in the country took the ACT, while 50 percent reported taking the SAT. The average national composite scores for those tests were 20.9 out of a possible 36 for the ACT and 1,498 out of a possible 2,400 for the SAT.[20]
New Jersey schools reported a graduation rate of 87.5 percent during the 2012-2013 school year, which was highest among its neighboring states.
In New Jersey, more students took the SAT than the ACT in 2013, earning an average SAT score of 1,521.
| Comparison table for graduation rates and test scores, 2012-2013 | |||||||
|---|---|---|---|---|---|---|---|
| State | Graduation rate, 2013 | Average ACT composite, 2013 | Average SAT composite, 2013 | ||||
| Percent | Quintile ranking** | Score | Participation rate | Score | Participation rate | ||
| New Jersey | 87.5% | First | 23 | 23% | 1,521 | 78% | |
| Delaware | 80.4% | Fourth | 22.9 | 15% | 1,351 | 100% | |
| New York | 76.8% | Fourth | 23.4 | 26% | 1,463 | 76% | |
| Pennsylvania | 85.5% | Second | 22.7 | 18% | 1,480 | 71% | |
| United States | 81.4% | 20.9 | 54% | 1498 | 50% | ||
| **Graduation rates for states in the first quintile ranked in the top 20 percent nationally. Similarly, graduation rates for states in the fifth quintile ranked in the bottom 20 percent nationally. Sources: United States Department of Education, "ED Data Express" ACT.org, "2013 ACT National and State Scores" The Commonwealth Foundation, "SAT scores by state, 2013" | |||||||
Dropout rate
- See also: Public high school dropout rates by state for a full comparison of dropout rates by group in all states
The high school event dropout rate indicates the proportion of students who were enrolled at some time during the school year and were expected to be enrolled in grades nine through 12 in the following school year but were not enrolled by October 1 of the following school year. Students who have graduated, transferred to another school, died, moved to another country, or who are out of school due to illness are not considered dropouts. The average public high school event dropout rate for the United States remained constant at 3.3 percent for both school year 2010–2011 and school year 2011–2012. The event dropout rate for New Jersey was lower than the national average at 1.4 percent in the 2010-2011 school year, and 1.4 percent in the 2011-2012 school year.[21]
See also
| New Jersey | School Boards | News and Analysis |
|---|---|---|
 |
 | |
|
Footnotes
- ↑ National Center for Education Statistics, "Elementary/Secondary Information System," accessed April 20, 2015
- ↑ 2.0 2.1 2.2 The Trentonian, "Hamilton schools chief admits unsafe playgrounds were not properly monitored," September 29, 2015
- ↑ 3.0 3.1 3.2 3.3 NBC New York, "Jersey City School Board Meeting Gets Heated During Debate Over Closing for Muslim Holiday," September 17, 2015
- ↑ 4.0 4.1 4.2 4.3 Clifton Journal, "Clifton school uniforms' path, costs explored," September 11, 2015
- ↑ NJ.com, "N.J. district shuts down playgrounds over safety issues," September 8, 2015
- ↑ 6.0 6.1 NJ.com, "Hamilton mayor extends help to district for closed playgrounds," September 9, 2015
- ↑ 7.0 7.1 7.2 NJ.com, "Jersey City won't close school for Islamic holiday," September 18, 2015
- ↑ NJ.com, "Students may have Islamic holiday off in Jersey City," September 11, 2015
- ↑ 9.0 9.1 9.2 Note: This text is quoted verbatim from the original source. Any inconsistencies are attributable to the original source.
- ↑ New Jersey School Boards Association, "Court: Schools Can Impose School Uniforms," accessed October 15, 2015
- ↑ Clifton Asserting Parental Rights, "About Our Organization," accessed October 15, 2015
- ↑ Clifton Journal, "Clifton's school uniforms committee dismantled," September 25, 2015
- ↑ 13.0 13.1 Clifton Journal, "Clifton school board candidates joust over school-uniform proposal," October 5, 2015
- ↑ Ballotpedia School Board Candidate Survey, 2015
- ↑ Ballotpedia School Board Candidate Survey, 2015, "Albert Gayzik responses," September 27, 2015
- ↑ The raw data for this study was provided by Dave Leip of Atlas of U.S. Presidential Elections.
- ↑ 17.0 17.1 United States Department of Education, ED Data Express, "State Tables," accessed May 13, 2014
- ↑ ACT, "2012 ACT National and State Scores," accessed May 13, 2014
- ↑ Commonwealth Foundation, "SAT Scores by State 2013," October 10, 2013
- ↑ StudyPoints, "What's a good SAT score or ACT score?" accessed June 7, 2015
- ↑ United States Department of Education, National Center for Education Statistics, "Common Core of Data (CCD), State Dropout and Graduation Rate Data File, School Year 2010-11, Provision Version 1a and School Year 2011-12, Preliminary Version 1a," accessed May 13, 2014
| |||||
