Mississippi school board elections, 2016: Difference between revisions
No edit summary |
No edit summary |
||
| Line 88: | Line 88: | ||
|- | |- | ||
| | | | ||
* [[Public education in Mississippi]] | * [[Public education in Mississippi]] | ||
* [[List of school districts in Mississippi]] | * [[List of school districts in Mississippi]] | ||
Revision as of 18:22, 3 November 2016
Presidential • U.S. House • Local judges • State ballot measures • School boards • Candidate ballot access |
← 2015 |
2017 →
|
Elections
General elections for Mississippi school boards were held on November 8, 2016. Special elections were held in conjunction with some general elections to fill vacancies.
Five of the seven Mississippi school districts among America's largest school districts by enrollment held school board elections for 10 seats in 2016. Here are several quick facts about those school board elections:
- The largest school district by enrollment with an election in 2016 was the DeSoto County School District with 33,054 K-12 students.
- The smallest Mississippi school district among the nation's largest with an election in 2016 was the Lamar County School District with 9,569 K-12 students.
- All of Mississippi's largest districts had two seats up for election in 2016.
The districts listed below served 88,721 K-12 students during the 2013-2014 school year, according to the National Center for Education Statistics.[1] Click on the district names for more information on each and its school board elections.
| 2016 Mississippi School Board Elections | |||||||
|---|---|---|---|---|---|---|---|
| District | General date | Regular term (years) | Seats up for election | Total board seats | Student enrollment | ||
| DeSoto County School District | 11/8/2016 | 6 | 2 | 5 | 33,054 | ||
| Harrison County School District | 11/8/2016 | 6 | 2 | 5 | 14,168 | ||
| Lamar County School District | 11/8/2016 | 6 | 2 | 5 | 9,569 | ||
| Madison County School District | 11/8/2016 | 6 | 2 | 5 | 12,548 | ||
| Rankin County School District | 11/8/2016 | 6 | 2 | 5 | 19,382 | ||
Elections trends
Trends in Mississippi school board elections

- See also: School boards in session: 2015 in brief
 |
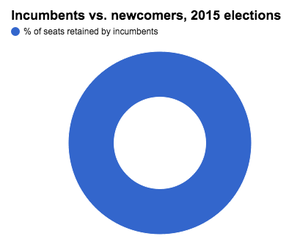
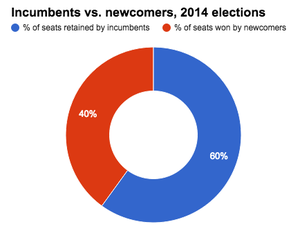
The 2015 school board elections held in Mississippi's largest school districts saw fewer candidates run per seat compared to the 2014 school board elections. One school district held an election for one seat in 2015. In 2014, five districts held elections for five seats. The one seat up for election in 2015 was unopposed. In 2014, one of the five seats on the ballot went unopposed. No newcomers were elected to the school board in 2015, but in 2014, newcomers took 40.00 percent of the seats on the ballot.
The following sections analyze competitiveness and incumbency advantage in Mississippi's school board elections. These districts did not utilize primary or runoff elections. Winners only had to receive a plurality, or relative majority, of votes to secure a seat. All of the school board elections held in the state in 2014 and 2015 were nonpartisan.
Details of the data discussed here can be found in the table below.
Competitiveness
In 2015, one incumbent ran for one seat on the ballot, and no one challenged him. In 2014, there was an average of 1.80 candidates running per seat. Nine candidates ran for five seats. One of those seats was unopposed.
Incumbency advantage
|
Because only one incumbent ran for one seat in 2015, there was a 100.00 percent incumbency retention rate that year. In 2014, 75.00 percent of incumbents who ran for re-election retained their seats. Four of the five incumbents whose terms were up for re-election ran to keep their seats, and three of them won. All three defeated challengers to win their bids for re-election. The one seat that went unopposed that year went to a newcomer. The map below details the success rates for incumbents who ran in the 2015 school board elections that were held in the largest school districts by enrollment in the U.S.
|
  |
Data table
| Mississippi school board elections, 2014 - 2015 | ||||||||||
|---|---|---|---|---|---|---|---|---|---|---|
| 2014 | 2015 | |||||||||
| All candidates | ||||||||||
| Seats up | 5 | 1 | ||||||||
| Candidates | 9 | 1 | ||||||||
| Candidates/seat | 1.80 | 1.00 | ||||||||
| Unopposed seats | 1 | 1 | ||||||||
| % unopposed | 20.00% | 100.00% | ||||||||
| % seats won by newcomers | 40.00% | 0.00% | ||||||||
| Incumbents | ||||||||||
| Sought re-election | 4 | 1 | ||||||||
| Unopposed | 0 | 1 | ||||||||
| Retained | 3 | 1 | ||||||||
| % retained | 75.00% | 100.00% | ||||||||
Academic performance
- See also: Public education in Mississippi
![]() The sections below do not contain the most recently published data on this subject. If you would like to help our coverage grow, consider donating to Ballotpedia.
The sections below do not contain the most recently published data on this subject. If you would like to help our coverage grow, consider donating to Ballotpedia.
| Education terms |
|---|
| For more information on education policy terms, see this article. |
NAEP scores
- See also: NAEP scores by state
The National Center for Education Statistics provides state-by-state data on student achievement levels in mathematics and reading in the National Assessment of Educational Progress (NAEP). The table below presents the percentage of fourth and eighth grade students that scored at or above proficient in reading and math during school year 2012-2013. Compared to three neighboring states (Alabama, Arkansas, and Louisiana), Mississippi's scores were the lowest nearly across the board.[2]
| Percent of students scoring at or above proficient, 2012-2013 | ||||
|---|---|---|---|---|
| Math - Grade 4 | Math - Grade 8 | Reading - Grade 4 | Reading - Grade 8 | |
| Mississippi | 26% | 21% | 21% | 20% |
| Alabama | 38% | 20% | 31% | 25% |
| Arkansas | 39% | 28% | 32% | 30% |
| Louisiana | 26% | 21% | 23% | 24% |
| United States | 41% | 34% | 34% | 34% |
| Source: United States Department of Education, ED Data Express, "State Tables" | ||||
Graduation, ACT and SAT scores
The following table shows the graduation rates and average composite ACT and SAT scores for Mississippi and surrounding states during the 2012-2013 school year. All statements made in this section refer to that school year.[2][3][4]
In the United States, public schools reported graduation rates that averaged to about 81.4 percent. About 54 percent of all students in the country took the ACT, while 50 percent reported taking the SAT. The average national composite scores for those tests were 20.9 out of a possible 36 for the ACT, and 1498 out of a possible 2400 for the SAT.[5]
Mississippi schools reported a graduation rate of 75.5 percent during the 2012-2013 school year, second lowest among its neighboring states.
In Mississippi, more students took the ACT than the SAT in 2013, earning an average ACT score of 18.9.
| Comparison table for graduation rates and test scores, 2012-2013 | |||||||
|---|---|---|---|---|---|---|---|
| State | Graduation rate, 2013 | Average ACT composite, 2013 | Average SAT composite, 2013 | ||||
| Percent | Quintile ranking** | Score | Participation rate | Score | Participation rate | ||
| Mississippi | 75.5% | Fifth | 18.9 | 95% | 1,673 | 3% | |
| Alabama | 80% | Fourth | 20.4 | 78% | 1,608 | 7% | |
| Arkansas | 84.9% | Second | 20.2 | 90% | 1,697 | 4% | |
| Louisiana | 73.5% | Fifth | 19.5 | 100% | 1,655 | 5% | |
| United States | 81.4% | 20.9 | 54% | 1498 | 50% | ||
| **Graduation rates for states in the first quintile ranked in the top 20 percent nationally. Similarly, graduation rates for states in the fifth quintile ranked in the bottom 20 percent nationally. Sources: United States Department of Education, "ED Data Express" ACT.org, "2013 ACT National and State Scores" The Commonwealth Foundation, "SAT scores by state, 2013" | |||||||
Dropout rate
- See also: Public high school dropout rates by state for a full comparison of dropout rates by group in all states
The high school event dropout rate indicates the proportion of students who were enrolled at some time during the school year and were expected to be enrolled in grades nine through 12 in the following school year but were not enrolled by October 1 of the following school year. Students who have graduated, transferred to another school, died, moved to another country, or who are out of school due to illness are not considered dropouts. The average public high school event dropout rate for the United States remained constant at 3.3 percent for both school year 2010–2011 and school year 2011–2012. The event dropout rate for Mississippi was lower than the national average at 3.2 percent in the 2010-2011 school year, and 3.2 percent in the 2011-2012 school year.[6]
State profile
State profile
| Demographic data for Mississippi | ||
|---|---|---|
| Mississippi | U.S. | |
| Total population: | 2,989,390 | 316,515,021 |
| Land area (sq mi): | 46,923 | 3,531,905 |
| Race and ethnicity** | ||
| White: | 59.2% | 73.6% |
| Black/African American: | 37.4% | 12.6% |
| Asian: | 1% | 5.1% |
| Native American: | 0.4% | 0.8% |
| Pacific Islander: | 0% | 0.2% |
| Two or more: | 1.2% | 3% |
| Hispanic/Latino: | 2.9% | 17.1% |
| Education | ||
| High school graduation rate: | 82.3% | 86.7% |
| College graduation rate: | 20.7% | 29.8% |
| Income | ||
| Median household income: | $39,665 | $53,889 |
| Persons below poverty level: | 27% | 11.3% |
| Source: U.S. Census Bureau, "American Community Survey" (5-year estimates 2010-2015) Click here for more information on the 2020 census and here for more on its impact on the redistricting process in Mississippi. **Note: Percentages for race and ethnicity may add up to more than 100 percent because respondents may report more than one race and the Hispanic/Latino ethnicity may be selected in conjunction with any race. Read more about race and ethnicity in the census here. | ||
Presidential voting pattern
Mississippi voted Republican in all seven presidential elections between 2000 and 2024.
Pivot Counties (2016)
Ballotpedia identified 206 counties that voted for Donald Trump (R) in 2016 after voting for Barack Obama (D) in 2008 and 2012. Collectively, Trump won these Pivot Counties by more than 580,000 votes. Of these 206 counties, two are located in Mississippi, accounting for 0.97 percent of the total pivot counties.[7]
Pivot Counties (2020)
In 2020, Ballotpedia re-examined the 206 Pivot Counties to view their voting patterns following that year's presidential election. Ballotpedia defined those won by Trump won as Retained Pivot Counties and those won by Joe Biden (D) as Boomerang Pivot Counties. Nationwide, there were 181 Retained Pivot Counties and 25 Boomerang Pivot Counties. Mississippi had two Retained Pivot Counties, 1.10 of all Retained Pivot Counties.
More Mississippi coverage on Ballotpedia
- Elections in Mississippi
- United States congressional delegations from Mississippi
- Public policy in Mississippi
- Endorsers in Mississippi
- Mississippi fact checks
- More...
See also
| Mississippi | School Boards | News and Analysis |
|---|---|---|
 |
 | |
Footnotes
- ↑ National Center for Education Statistics, "Elementary/Secondary Information System," accessed November 20, 2015
- ↑ 2.0 2.1 United States Department of Education, ED Data Express, "State Tables," accessed May 13, 2014
- ↑ ACT, "2012 ACT National and State Scores," accessed May 13, 2014
- ↑ Commonwealth Foundation, "SAT Scores by State 2013," October 10, 2013
- ↑ StudyPoints, "What's a good SAT score or ACT score?" accessed June 7, 2015
- ↑ United States Department of Education, National Center for Education Statistics, "Common Core of Data (CCD), State Dropout and Graduation Rate Data File, School Year 2010-11, Provision Version 1a and School Year 2011-12, Preliminary Version 1a," accessed May 13, 2014
- ↑ The raw data for this study was provided by Dave Leip of Atlas of U.S. Presidential Elections.
| |||||