Your feedback ensures we stay focused on the facts that matter to you most—take our survey
Ontario-Montclair Elementary School District, California
Ballotpedia provides comprehensive election coverage of the 100 largest cities in America by population as well as mayoral, city council, and district attorney election coverage in state capitals outside of the 100 largest cities. This school district is outside of that coverage scope and does not receive scheduled updates.
| Ontario-Montclair Elementary School District |
|---|
| San Bernardino County, California |
| District details |
| Superintendent: Dr. James Q. Hammond |
| # of school board members: 5 members |
| Website: Link |
Ontario-Montclair Elementary School District is a school district in California that served 22,767 students during the 2013-2014 school year, according to the Education Data Partnership.[1] This district was the 61st-largest by enrollment in the state of California during the 2012-2013 school year, according to the National Center for Education Statistics.[2]
About the district
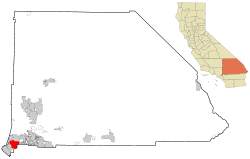
The Ontario-Montclair Elementary School District is located in San Bernardino County in southern California. The county seat is San Bernardino. San Bernardino County was home to 2,128,133 residents in 2015, according to the United States Census Bureau.[3]
Demographics
San Bernardino County underperformed compared to California as a whole in terms of higher education achievement from 2010 to 2014. The United States Census Bureau found that 18.8 percent of county residents aged 25 years and older had attained a bachelor's degree, compared to 31 percent of state residents. The median household income for San Bernardino County was $54,100, compared to $61,489 for the entire state. The percentage of people in poverty in the county was 20.4 percent, while it was 16.4 percent statewide.[3]
|
| ||||||||||||||||||||||||||||||||||||||||||||||
Note: Percentages for race and ethnicity may add up to more than 100 percent because respondents may report more than one race and the Hispanic/Latino ethnicity may be selected in conjunction with any race. Read more about race and ethnicity in the census here.
Superintendent
| |
This information is updated as we become aware of changes. Please contact us with any updates. |
Dr. James Q. Hammond is the superintendent of the Ontario-Montclair Elementary School District. He took the position in 2010. He previously worked for the Davis Joint Unified School District.[6] Hammond was one of the highest paid superintendents in California in 2013, making a total of $492,076.92 in salary and benefits.[7]
School board elections
The Ontario-Montclair Board of Trustees consists of five members elected at large to four-year terms.[8]
| Ontario-Montclair Board of Trustees | ||
|---|---|---|
| Member | First elected | Term Ends |
| Samuel Crowe | 2008 | 2018 |
| Michael C. Flores | 2014 | 2018 |
| Sarah Galvez | 2016 | 2020 |
| Elvia M. Rivas | 2010 | 2018 |
| Alfonso Sanchez | 2014 | 2020 |
| |
This officeholder information was last updated on April 10, 2018. Please contact us with any updates. | |
Election dates
Members of the Ontario-Montclair Board of Trustees are elected at large to four-year terms on a staggered basis every November of even-numbered years. One two-year term and three four-year terms were up for election on November 4, 2014, and two seats were up for election on November 8, 2016.[8]
Public participation in board meetings
The Ontario-Montclair Board of Trustees maintains the following policy regarding public participation in board meetings, which was last updated in April 2007:
| “ | Public Participation
Members of the public are encouraged to attend Board meetings and to address the Board concerning any item on the agenda or within the Board's jurisdiction. So as not to inhibit public participation, persons attending Board meetings shall not be requested to sign in, complete a questionnaire, or otherwise provide their name or other information as a condition of attending the meeting. In order to conduct district business in an orderly and efficient manner, the Board requires that public presentations to the Board comply with the following procedures: 1. The Board shall give members of the public an opportunity to address the Board on any item of interest to the public that is within the subject matter jurisdiction of the Board, either before or during the Board's consideration of the item. (Education Code 35145.5, Government Code 54954.3) 2. At a time so designated on the agenda at a regular meeting, members of the public may bring before the Board matters that are not listed on the agenda. The Board shall take no action or discussion on any item not appearing on the posted agenda, except as authorized by law. (Education Code 35145.5, Government Code 54954.2) 3. Without taking action, Board members or district staff members may briefly respond to statements made or questions posed by the public about items not appearing on the agenda. Additionally, on their own initiative or in response to questions posed by the public, a Board or staff member may ask a question for clarification, make a brief announcement, or make a brief report on his/her own activities. (Government Code 54954.2) Furthermore, the Board or a Board member may provide a reference to staff or other resources for factual information, ask staff to report back to the Board at a subsequent meeting concerning any matter. (Government Code 54954.2) A Trustee wanting to place an item on a future agenda will inform the Board president. The president will inform the Superintendent. Once informed, the Superintendent will discuss the item with Cabinet. The Superintendent will communicate Cabinet's input and recommendation to the Trustee. If the Trustee is not satisfied with the result, the Superintendent will present the agenda suggestion to the Board for discussion and direction. 4. The Board need not allow the public to speak on any item that has already been considered by a committee composed exclusively of Board members at a public meeting where the public had the opportunity to address the committee on that item. However, if the Board determines that the item has been substantially changed since the committee heard the item, the Board shall provide an opportunity for the public to speak. (Government Code 54954.3) (cf. 9130 - Board Committees) 5. A person wishing to be heard by the Board shall first be recognized by the president and shall then proceed to comment as briefly as the subject permits. Individual speakers shall be allowed four minutes to address the Board on each agenda or nonagenda item. The Board shall limit the total time for public input on each item to 12 minutes. With Board consent, the president may increase or decrease the time allowed for public presentation, depending on the topic and the number of persons wishing to be heard. The president may take a poll of speakers for or against a particular issue and may ask that additional persons speak only if they have something new to add. 6. The Board president may rule on the appropriateness of a topic. If the topic would be more suitably addressed at a later time, the president may indicate the time and place when it should be presented. The Board shall not prohibit public criticism of its policies, procedures, programs, services, acts, or omissions. (Government Code 54954.3) In addition, the Board may not prohibit public criticism of district employees. Whenever a member of the public initiates specific complaints or charges against an employee, the Board president shall inform the complainant that in order to protect the employee's right to adequate notice before a hearing of such complaints and charges, and also to preserve the ability of the Board to legally consider the complaints or charges in any subsequent evaluation of the employee, it is the policy of the Board to hear such complaints or charges in closed session unless otherwise requested by the employee pursuant to Government Code 54957. The Board president shall also encourage the complainant to file a complaint using the appropriate district complaint procedure. (cf. 1312.1 - Complaints Concerning District Employees) (cf. 9321 - Closed Session Purposes and Agendas) 7. The Board president shall not permit any disturbance or willful interruption of Board meetings. Persistent disruption by an individual or group shall be grounds for the president to terminate the privilege of addressing the Board. The Board may remove disruptive individuals and order the room cleared if necessary. In this case, members of the media not participating in the disturbance shall be allowed to remain, and individuals not participating in such disturbances may be allowed to remain at the discretion of the Board. When the room is ordered cleared due to a disturbance, further Board proceedings shall concern only matters appearing on the agenda. (Government Code 54957.9) When such disruptive conduct occurs, the Superintendent or designee shall contact local law enforcement.[9] |
” |
| —Ontario-Montclair Board of Trustees (2007)[10] | ||
Budget
From 1993 to 2013, the Ontario-Montclair Elementary School District had an average of $188,369,667 in revenue and $183,860,429 in expenditures, according to the United States Census Bureau's survey of school system finances. The district had a yearly average of $25,629,762 in outstanding debt. The district retired $2,070,905 of its debt and issued $3,436,000 in new debt each year on average.[11]
Revenue
The table below separates the district's revenue into the three sources identified by the agency: local, state, and federal.
| Revenue by Source | |||||||||||
|---|---|---|---|---|---|---|---|---|---|---|---|
| Fiscal Year |
Local | State | Federal | Revenue Total | |||||||
| Total | % of Revenue | Total | % of Revenue | Total | % of Revenue | ||||||
| Click [show] on the right to display the revenue data for prior years. | |||||||||||
|---|---|---|---|---|---|---|---|---|---|---|---|
| 1993 | $15,431,000 | 15.93% | $73,210,000 | 75.58% | $8,227,000 | 8.49% | $96,868,000 | ||||
| 1994 | $20,403,000 | 19.91% | $72,615,000 | 70.88% | $9,437,000 | 9.21% | $102,455,000 | ||||
| 1995 | $23,277,000 | 20.41% | $80,198,000 | 70.33% | $10,557,000 | 9.26% | $114,032,000 | ||||
| 1996 | $19,334,000 | 17.23% | $81,690,000 | 72.81% | $11,168,000 | 9.95% | $112,192,000 | ||||
| 1997 | $25,079,000 | 19.43% | $93,322,000 | 72.31% | $10,662,000 | 8.26% | $129,063,000 | ||||
| 1998 | $22,562,000 | 14.94% | $115,481,000 | 76.45% | $13,016,000 | 8.62% | $151,059,000 | ||||
| 1999 | $29,955,000 | 20.54% | $101,438,000 | 69.56% | $14,429,000 | 9.89% | $145,822,000 | ||||
| 2000 | $31,487,000 | 19.70% | $110,350,000 | 69.06% | $17,956,000 | 11.24% | $159,793,000 | ||||
| 2001 | $32,455,000 | 17.39% | $135,076,000 | 72.37% | $19,127,000 | 10.25% | $186,658,000 | ||||
| 2002 | $36,364,000 | 17.67% | $146,664,000 | 71.27% | $22,760,000 | 11.06% | $205,788,000 | ||||
| 2003 | $42,564,000 | 18.00% | $168,875,000 | 71.40% | $25,076,000 | 10.60% | $236,515,000 | ||||
| 2004 | $42,710,000 | 20.84% | $134,160,000 | 65.46% | $28,078,000 | 13.70% | $204,948,000 | ||||
| 2005 | $38,995,000 | 17.02% | $160,530,000 | 70.08% | $29,555,000 | 12.90% | $229,080,000 | ||||
| 2006 | $32,439,000 | 14.97% | $153,936,000 | 71.03% | $30,355,000 | 14.01% | $216,730,000 | ||||
| 2007 | $38,076,000 | 11.81% | $251,384,000 | 77.97% | $32,964,000 | 10.22% | $322,424,000 | ||||
| 2008 | $43,904,000 | 17.97% | $169,143,000 | 69.23% | $31,261,000 | 12.80% | $244,308,000 | ||||
| 2009 | $37,512,000 | 16.44% | $156,574,000 | 68.62% | $34,100,000 | 14.94% | $228,186,000 | ||||
| 2010 | $39,000,000 | 18.30% | $141,342,000 | 66.34% | $32,722,000 | 15.36% | $213,064,000 |
| 2011 | $37,338,000 | 16.62% | $147,572,000 | 65.69% | $39,743,000 | 17.69% | $224,653,000 |
| 2012 | $37,468,000 | 17.07% | $147,941,000 | 67.42% | $34,034,000 | 15.51% | $219,443,000 |
| 2013 | $38,690,000 | 18.19% | $145,746,000 | 68.53% | $28,246,000 | 13.28% | $212,682,000 |
| Avg. | $32,621,095 | 17.64% | $132,726,048 | 70.59% | $23,022,524 | 11.77% | $188,369,667 |
Expenditures
The table below separates the district's expenditures into five categories identified by the agency:
- Instruction: operation expenditures, state payments on behalf of the district for instruction and benefits, and retirement system transfers
- Support Services: support services, food services, and retirement system transfers for support service staff
- Capital Spending: capital outlay expenditures (i.e., construction, land or facilities purchases, and equipment purchases)
- Debt & Gov. Payments: payments to state and local governments and interest on school system debt
- Other: all other non-K-12 programs, except food services
| Expenditures by Category | |||||||||||
|---|---|---|---|---|---|---|---|---|---|---|---|
| Fiscal Year |
Instruction | Support Services | Capital Spending | Debt & Gov. Payments | Other | Budget Total | |||||
| Total | % of Budget | Total | % of Budget | Total | % of Budget | Total | % of Budget | Total | % of Budget | ||
| Click [show] on the right to display the expenditure data for prior years. | |||||||||||
|---|---|---|---|---|---|---|---|---|---|---|---|
| 1993 | $58,118,000 | 60.79% | $32,490,000 | 33.98% | $4,684,000 | 4.90% | $195,000 | 0.20% | $120,000 | 0.13% | $95,607,000 |
| 1994 | $61,631,000 | 60.01% | $31,869,000 | 31.03% | $8,948,000 | 8.71% | $78,000 | 0.08% | $183,000 | 0.18% | $102,709,000 |
| 1995 | $64,093,000 | 57.54% | $31,327,000 | 28.13% | $14,860,000 | 13.34% | $292,000 | 0.26% | $807,000 | 0.72% | $111,379,000 |
| 1996 | $68,178,000 | 57.96% | $33,947,000 | 28.86% | $14,520,000 | 12.34% | $283,000 | 0.24% | $697,000 | 0.59% | $117,625,000 |
| 1997 | $75,293,000 | 58.43% | $35,999,000 | 27.94% | $15,663,000 | 12.16% | $1,160,000 | 0.90% | $738,000 | 0.57% | $128,853,000 |
| 1998 | $83,695,000 | 57.11% | $41,114,000 | 28.06% | $21,229,000 | 14.49% | $0 | 0.00% | $504,000 | 0.34% | $146,542,000 |
| 1999 | $83,971,000 | 58.13% | $47,017,000 | 32.55% | $12,410,000 | 8.59% | $910,000 | 0.63% | $149,000 | 0.10% | $144,457,000 |
| 2000 | $94,678,000 | 58.61% | $49,154,000 | 30.43% | $14,258,000 | 8.83% | $880,000 | 0.54% | $2,577,000 | 1.60% | $161,547,000 |
| 2001 | $112,200,000 | 59.78% | $61,374,000 | 32.70% | $11,986,000 | 6.39% | $868,000 | 0.46% | $1,266,000 | 0.67% | $187,694,000 |
| 2002 | $125,876,000 | 62.70% | $68,725,000 | 34.23% | $4,534,000 | 2.26% | $1,156,000 | 0.58% | $469,000 | 0.23% | $200,760,000 |
| 2003 | $124,955,000 | 61.01% | $70,212,000 | 34.28% | $4,799,000 | 2.34% | $1,898,000 | 0.93% | $2,953,000 | 1.44% | $204,817,000 |
| 2004 | $120,152,000 | 58.49% | $71,448,000 | 34.78% | $10,100,000 | 4.92% | $2,521,000 | 1.23% | $1,208,000 | 0.59% | $205,429,000 |
| 2005 | $121,690,000 | 58.06% | $73,000,000 | 34.83% | $11,405,000 | 5.44% | $1,885,000 | 0.90% | $1,615,000 | 0.77% | $209,595,000 |
| 2006 | $123,873,000 | 59.56% | $72,918,000 | 35.06% | $9,511,000 | 4.57% | $1,458,000 | 0.70% | $220,000 | 0.11% | $207,980,000 |
| 2007 | $137,269,000 | 50.22% | $78,003,000 | 28.54% | $56,546,000 | 20.69% | $902,000 | 0.33% | $614,000 | 0.22% | $273,334,000 |
| 2008 | $132,453,000 | 52.50% | $77,433,000 | 30.69% | $40,771,000 | 16.16% | $1,095,000 | 0.43% | $543,000 | 0.22% | $252,295,000 |
| 2009 | $142,424,000 | 56.72% | $78,709,000 | 31.34% | $27,800,000 | 11.07% | $1,308,000 | 0.52% | $867,000 | 0.35% | $251,108,000 |
| 2010 | $129,523,000 | 57.66% | $71,775,000 | 31.95% | $21,261,000 | 9.47% | $1,516,000 | 0.67% | $540,000 | 0.24% | $224,615,000 |
| 2011 | $129,587,000 | 61.71% | $67,919,000 | 32.34% | $9,289,000 | 4.42% | $2,662,000 | 1.27% | $532,000 | 0.25% | $209,989,000 |
| 2012 | $128,629,000 | 61.22% | $70,380,000 | 33.50% | $8,070,000 | 3.84% | $2,639,000 | 1.26% | $382,000 | 0.18% | $210,100,000 |
| 2013 | $131,465,000 | 61.25% | $70,804,000 | 32.99% | $9,346,000 | 4.35% | $2,614,000 | 1.22% | $405,000 | 0.19% | $214,634,000 |
| Avg. | $107,131,095 | 58.55% | $58,838,905 | 31.82% | $15,809,048 | 8.54% | $1,253,333 | 0.64% | $828,048 | 0.46% | $183,860,429 |
Debt
The table below shows the amount of debt retired, issued, and outstanding in the district for each year.
| Debt | |||
|---|---|---|---|
| Fiscal Year |
Retired | Issued | Outstanding |
| Click [show] on the right to display the debt data for prior years. | |||
|---|---|---|---|
| 1993 | $0 | $0 | $0 |
| 1994 | $0 | $0 | $0 |
| 1995 | $0 | $0 | $0 |
| 1996 | $0 | $0 | $0 |
| 1997 | $88,000 | $0 | $18,735,000 |
| 1998 | $0 | $0 | $0 |
| 1999 | $495,000 | $0 | $17,915,000 |
| 2000 | $540,000 | $0 | $17,375,000 |
| 2001 | $0 | $0 | $17,375,000 |
| 2002 | $0 | $11,325,000 | $28,700,000 |
| 2003 | $145,000 | $18,350,000 | $46,905,000 |
| 2004 | $23,245,000 | $0 | $28,380,000 |
| 2005 | $935,000 | $0 | $29,015,000 |
| 2006 | $1,570,000 | $0 | $25,875,000 |
| 2007 | $1,690,000 | $0 | $24,185,000 |
| 2008 | $10,125,000 | $18,032,000 | $32,092,000 |
| 2009 | $714,000 | $0 | $32,345,000 |
| 2010 | $1,354,000 | $23,467,000 | $54,606,000 |
| 2011 | $775,000 | $0 | $55,093,000 |
| 2012 | $889,000 | $473,000 | $55,022,000 |
| 2013 | $924,000 | $509,000 | $54,607,000 |
| Avg. | $2,070,905 | $3,436,000 | $25,629,762 |
Teacher salaries
The Ontario-Montclair Elementary School District employed 1,072 teachers during the 2014-2015 school year.[12] The table below shows the salary schedule negotiated between the district and the Ontario-Montclair Teachers Association for the 2015-2016 school year. Teacher salary schedules are categorized by higher education achievement, professional development and years of service. A teacher with a bachelor's degree can earn a higher salary by pursuing graduate courses and gaining raises at credit intervals. Salary schedules also account for graduate degrees by providing higher starting salaries and greater potential salaries.[13]
| Salary structure | ||
|---|---|---|
| Degree level | Minimum salary | Maximum salary |
| B.A. | $45,153 | $57,463 |
| B.A. + 15 | $47,636 | $65,695 |
| B.A. + 30 | $50,256 | $80,210 |
| B.A. + 45 or M.A. | $53,020 | $87,540 |
| B.A. + 60 or B.A. + 45 with M.A. | $55,937 | $92,075 |
| B.A. + 75 or B.A. + 60 with M.A. | $59,014 | $96,864 |
Unions
Teachers in the Ontario-Montclair Elementary School District are represented by the Ontario-Montclair Teachers Association. The union was led by the following executive board for the 2015-2016 school year:[14]
| Ontario-Montclair Teachers Association Executive Board | |
|---|---|
| Board member | Leadership position |
| Amy Johnson | President |
| MaryKay Scheid | 1st vice president |
| Daniel Salcido | 2nd vice president |
| Melody Kelly | Secretary |
| Erine Ames | Treasurer |
Issues
Court rules test scores not required in teacher evaluations
Contra Costa County Superior Court Judge Barry Goode ruled in September 2016 that the Ontario-Montclair Elementary School District, along with 12 other school districts, could not be required to use student test scores in teacher evaluations. Goode's ruling went against a lawsuit filed by the group Students Matter, which sought to mandate the use of student standardized test scores in teacher evaluations. Students Matter argued that the districts' teacher contracts violated California's 1971 Stull Act, which requires school districts to evaluate teachers in a manner related to student performance. Goode concluded that all of the school districts in question were meeting their legal obligations.[15]
“The Legislature endorses many uses of those tests, including evaluating pupils, entire schools and local educational agencies,” Goode wrote in his opinion. “But it does not say the results should be used to evaluate individual teachers.”[15]
Marcellus McRae, who represented the plaintiffs, said he was surprised by the ruling. “If you really think about it, this is such a basic concept that the goal of teaching is for students to learn,” McRae said. “It is, to me, axiomatic that teacher evaluations have to be based at least in part over whether students have learned.”[15]
Students Matter won a similar case in 2012. That lawsuit had been filed against the Los Angeles Unified School District, and the school district was ultimately required to include test scores in its teacher evaluations. In the 2016 case, however, Goode ruled that school districts were allowed to decide how to use test results. “There are serious questions about whether, and the extent to which, a pupil’s standardized test score is ‘reasonably related’ and ‘applicable’ to the performance of a given teacher,” Goode said.[15]
Teachers unions supported Goode's ruling. They argued that standardized test scores overlooked external factors that inhibited student learning, such as poverty.[15]
“Every day teachers across California use a variety of benchmarks, including in-class quizzes, tests, projects, and personal observation to fine-tune their approaches with their students,” said California Federation of Teachers President Joshua Pechthalt. “There is no single method for assessing progress that is ideal or that should be used to the exclusion of all others.”[15]
Contact information

Ontario-Montclair Elementary School District
950 West D St.
Ontario, CA 91762
Phone: (909) 459-2500
Email: info@omsd.net
See also
| California | School Board Elections | News and Analysis |
|---|---|---|
 |
 | |
External links
- Ontario-Montclair Elementary School District
- Ontario-Montclair Teachers Association
- San Bernardino County, California
- California Department of Education
- California School Boards Association
Footnotes
- ↑ Education Data Partnership, "District Reports: Profile of District," accessed July 14, 2015
- ↑ National Center for Education Statistics, "ELSI Table Generator," accessed April 29, 2015
- ↑ 3.0 3.1 3.2 United States Census Bureau, "San Bernardino County, California," accessed July 5, 2016
- ↑ San Bernardino County Registrar of Voters, "Past Election Archives," accessed July 14, 2014
- ↑ San Bernardino County Registrar of Voters, "Past Elections: 2007-1996," accessed July 14, 2014
- ↑ Daily Bulletin, "Ontario-Montclair superintendent who makes $261,206 gets 5% raise," July 10, 2014
- ↑ Daily Bulletin, "Ontario-Montclair schools superintendent James Hammond made $492K," July 25, 2014
- ↑ 8.0 8.1 Ontario-Montclair Elementary School District, "Board of Trustees," accessed July 28, 2015
- ↑ Note: This text is quoted verbatim from the original source. Any inconsistencies are attributable to the original source.
- ↑ Ontario-Montclair Elementary School District, "Board Bylaws: BB 9323 Meeting Conduct," accessed July 28, 2015
- ↑ United States Census Bureau, "Public School System Finances: Historical Data," accessed December 1, 2015
- ↑ Education Data Partnership, "District summary: Ontario-Montclair," accessed March 9, 2016
- ↑ Ontario-Montclair School District, "Teachers' Salary Schedule," accessed March 9, 2016
- ↑ Ontario-Montclair Teachers Association, "Executive Board," accessed March 9, 2016
- ↑ 15.0 15.1 15.2 15.3 15.4 15.5 Los Angeles Times, "Court refuses to mandate use of test scores in teacher evaluations," September 22, 2016
| |||||
 |
State of California Sacramento (capital) |
|---|---|
| Elections |
What's on my ballot? | Elections in 2025 | How to vote | How to run for office | Ballot measures |
| Government |
Who represents me? | U.S. President | U.S. Congress | Federal courts | State executives | State legislature | State and local courts | Counties | Cities | School districts | Public policy |