Cincinnati Public Schools, Ohio
| Cincinnati Public Schools |
|---|
| Cincinnati, Ohio |
| District details |
| Superintendent: Mary Ronan |
| # of school board members: 7 |
| Website: Link |
The Cincinnati Public School District (CPS) is a school district in Ohio that served 30,310 K-12 students during the 2012-2013 school year. The district was the third largest by enrollment in the state of Ohio.[1] Cincinnati Public Schools dates back to 1829 with the creation of the Common Schools of Cincinnati.[2]
About the district
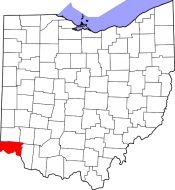
Cincinnati is the county seat of Hamilton County and located in southwestern Ohio. The city's population was 296,946 according to the 2010 U.S. Census.[3]
Demographics
Cincinnati lags behind the rest of Ohio in terms of median income and poverty rate while outpacing the state in higher education attainment. The 2010 U.S. Census found that 31% of Cincinnati residents over 25 years old held undergraduate degrees compared to a 24.5% rate for the state of Ohio. Cincinnati had a median income of $34,104 in 2010 compared to $48,071 for Ohio. The poverty rate for Cincinnati was 27.4% in 2010 compared to an 14.8% rate for the rest of the state.[3]
|
| ||||||||||||||||||||||||||||||||||||||||||
Note: Percentages for race and ethnicity may add up to more than 100 percent because respondents may report more than one race and the Hispanic/Latino ethnicity may be selected in conjunction with any race. Read more about race and ethnicity in the census here.
Superintendent
The current Superintendent of Cincinnati Public Schools is Mary Ronan, who has served in the position since April 2009. She has worked in the district since 1976 including a brief stint as Interim Superintendent from 2008 to 2009 and Director of Schools from 2005 to 2008.[6] Ronan earned an annual salary of $189,000 during the 2011-2012 school year.[7]
School board
The Cincinnati Board of Education consists of seven members who are elected at-large to four-year terms. Annual compensation for board members is determined when new members are sworn into office though members often donate compensation to a trust fund that covers board expenses. Each member can participate in the district's health and life insurance plans as well as the State Employees Retirement System.[8]
| Cincinnati Board of Education | |||
|---|---|---|---|
| Member | Assumed Office | Term Ends | |
| Ericka Copeland-Dansby | 2013 | 2017 | |
| Carolyn Jones | 2012 | 2019 | |
| Melanie Bates | 2002 | 2017 | |
| Eve Bolton | 2008 | 2019 | |
| Elisa Hoffman | 2013 | 2017 | |
| Chris Nelms | 2008 | 2019 | |
| Daniel Minera | 2013 | 2017 | |
School board elections
Members of the Cincinnati Board of Education are elected at-large to four-year terms on a staggered basis. Three seats were up for election on November 3, 2015, and four seats will be on the ballot on November 7, 2017.
Budget
From 1993 to 2013, the Cincinnati school district had an average of $500,685,238 in revenue and $518,238,286 in expenditures, according to the United States Census Bureau's survey of school system finances. The district had a yearly average of $412,530,429 in outstanding debt. The district retired $42,981,238 of its debt and issued $74,735,810 in new debt each year on average.[9]
Revenue
The table below separates the district's revenue into the three sources identified by the agency: local, state, and federal.
| Revenue by Source | |||||||||||
|---|---|---|---|---|---|---|---|---|---|---|---|
| Fiscal Year |
Local | State | Federal | Revenue Total | |||||||
| Total | % of Revenue | Total | % of Revenue | Total | % of Revenue | ||||||
| Click [show] on the right to display the revenue data for prior years. | |||||||||||
|---|---|---|---|---|---|---|---|---|---|---|---|
| 1993 | $202,086,000 | 55.88% | $130,458,000 | 36.07% | $29,109,000 | 8.05% | $361,653,000 | ||||
| 1994 | $200,007,000 | 56.35% | $125,721,000 | 35.42% | $29,200,000 | 8.23% | $354,928,000 | ||||
| 1995 | $192,575,000 | 53.38% | $122,397,000 | 33.93% | $45,784,000 | 12.69% | $360,756,000 | ||||
| 1996 | $165,922,000 | 47.95% | $137,657,000 | 39.78% | $42,455,000 | 12.27% | $346,034,000 | ||||
| 1997 | $217,642,000 | 53.86% | $142,678,000 | 35.31% | $43,795,000 | 10.84% | $404,115,000 | ||||
| 1998 | $224,597,000 | 53.78% | $151,113,000 | 36.18% | $41,905,000 | 10.03% | $417,615,000 | ||||
| 1999 | $232,930,000 | 52.98% | $167,851,000 | 38.18% | $38,897,000 | 8.85% | $439,678,000 | ||||
| 2000 | $228,731,000 | 51.86% | $168,267,000 | 38.15% | $44,025,000 | 9.98% | $441,023,000 | ||||
| 2001 | $257,215,000 | 54.68% | $172,634,000 | 36.70% | $40,546,000 | 8.62% | $470,395,000 | ||||
| 2002 | $269,498,000 | 55.81% | $165,984,000 | 34.37% | $47,409,000 | 9.82% | $482,891,000 | ||||
| 2003 | $276,030,000 | 57.09% | $157,823,000 | 32.64% | $49,675,000 | 10.27% | $483,528,000 | ||||
| 2004 | $263,131,000 | 52.95% | $171,244,000 | 34.46% | $62,524,000 | 12.58% | $496,899,000 | ||||
| 2005 | $258,571,000 | 47.23% | $219,507,000 | 40.10% | $69,374,000 | 12.67% | $547,452,000 | ||||
| 2006 | $284,356,000 | 52.45% | $191,167,000 | 35.26% | $66,585,000 | 12.28% | $542,108,000 | ||||
| 2007 | $291,086,000 | 51.79% | $204,159,000 | 36.32% | $66,827,000 | 11.89% | $562,072,000 | ||||
| 2008 | $330,463,000 | 53.60% | $218,730,000 | 35.47% | $67,383,000 | 10.93% | $616,576,000 | ||||
| 2009 | $300,493,000 | 48.47% | $252,351,000 | 40.70% | $67,134,000 | 10.83% | $619,978,000 | ||||
| 2010 | $344,481,000 | 50.85% | $235,521,000 | 34.77% | $97,408,000 | 14.38% | $677,410,000 |
| 2011 | $313,498,000 | 46.71% | $246,085,000 | 36.67% | $111,577,000 | 16.62% | $671,160,000 |
| 2012 | $318,198,000 | 52.01% | $213,261,000 | 34.86% | $80,388,000 | 13.14% | $611,847,000 |
| 2013 | $328,933,000 | 54.26% | $205,158,000 | 33.84% | $72,181,000 | 11.91% | $606,272,000 |
| Avg. | $261,925,857 | 52.57% | $180,941,238 | 36.15% | $57,818,143 | 11.28% | $500,685,238 |
Expenditures
The table below separates the district's expenditures into five categories identified by the agency:
- Instruction: operation expenditures, state payments on behalf of the district for instruction and benefits, and retirement system transfers
- Support Services: support services, food services, and retirement system transfers for support service staff
- Capital Spending: capital outlay expenditures (i.e., construction, land or facilities purchases, and equipment purchases)
- Debt & Gov. Payments: payments to state and local governments and interest on school system debt
- Other: all other non-K-12 programs, except food services
| Expenditures by Category | |||||||||||
|---|---|---|---|---|---|---|---|---|---|---|---|
| Fiscal Year |
Instruction | Support Services | Capital Spending | Debt & Gov. Payments | Other | Budget Total | |||||
| Total | % of Budget | Total | % of Budget | Total | % of Budget | Total | % of Budget | Total | % of Budget | ||
| Click [show] on the right to display the expenditure data for prior years. | |||||||||||
|---|---|---|---|---|---|---|---|---|---|---|---|
| 1993 | $202,000,000 | 58.39% | $129,897,000 | 37.55% | $9,541,000 | 2.76% | $4,412,000 | 1.28% | $86,000 | 0.02% | $345,936,000 |
| 1994 | $203,525,000 | 58.24% | $133,700,000 | 38.26% | $4,612,000 | 1.32% | $4,982,000 | 1.43% | $2,643,000 | 0.76% | $349,462,000 |
| 1995 | $207,355,000 | 56.84% | $129,793,000 | 35.58% | $21,928,000 | 6.01% | $1,039,000 | 0.28% | $4,713,000 | 1.29% | $364,828,000 |
| 1996 | $206,256,000 | 60.01% | $113,376,000 | 32.99% | $14,869,000 | 4.33% | $411,000 | 0.12% | $8,790,000 | 2.56% | $343,702,000 |
| 1997 | $209,793,000 | 56.42% | $123,943,000 | 33.33% | $13,950,000 | 3.75% | $7,207,000 | 1.94% | $16,965,000 | 4.56% | $371,858,000 |
| 1998 | $219,770,000 | 56.39% | $130,237,000 | 33.41% | $16,442,000 | 4.22% | $7,958,000 | 2.04% | $15,359,000 | 3.94% | $389,766,000 |
| 1999 | $230,057,000 | 57.66% | $128,545,000 | 32.22% | $15,904,000 | 3.99% | $7,530,000 | 1.89% | $16,934,000 | 4.24% | $398,970,000 |
| 2000 | $217,607,000 | 53.25% | $136,866,000 | 33.49% | $22,547,000 | 5.52% | $13,458,000 | 3.29% | $18,148,000 | 4.44% | $408,626,000 |
| 2001 | $239,449,000 | 55.60% | $149,478,000 | 34.71% | $20,333,000 | 4.72% | $6,141,000 | 1.43% | $15,273,000 | 3.55% | $430,674,000 |
| 2002 | $270,649,000 | 55.97% | $146,358,000 | 30.27% | $37,280,000 | 7.71% | $9,289,000 | 1.92% | $20,009,000 | 4.14% | $483,585,000 |
| 2003 | $275,218,000 | 54.12% | $164,734,000 | 32.40% | $34,157,000 | 6.72% | $12,080,000 | 2.38% | $22,327,000 | 4.39% | $508,516,000 |
| 2004 | $290,085,000 | 53.38% | $189,022,000 | 34.78% | $46,847,000 | 8.62% | $1,315,000 | 0.24% | $16,170,000 | 2.98% | $543,439,000 |
| 2005 | $293,921,000 | 45.79% | $197,555,000 | 30.78% | $133,816,000 | 20.85% | $951,000 | 0.15% | $15,626,000 | 2.43% | $641,869,000 |
| 2006 | $282,875,000 | 47.21% | $184,808,000 | 30.84% | $113,274,000 | 18.90% | $878,000 | 0.15% | $17,343,000 | 2.89% | $599,178,000 |
| 2007 | $275,357,000 | 44.01% | $197,426,000 | 31.56% | $132,894,000 | 21.24% | $123,000 | 0.02% | $19,829,000 | 3.17% | $625,629,000 |
| 2008 | $274,636,000 | 40.87% | $193,690,000 | 28.82% | $138,316,000 | 20.58% | $40,098,000 | 5.97% | $25,271,000 | 3.76% | $672,011,000 |
| 2009 | $278,726,000 | 41.34% | $203,814,000 | 30.23% | $127,921,000 | 18.97% | $38,779,000 | 5.75% | $24,921,000 | 3.70% | $674,161,000 |
| 2010 | $292,703,000 | 41.95% | $206,820,000 | 29.64% | $137,400,000 | 19.69% | $36,246,000 | 5.19% | $24,569,000 | 3.52% | $697,738,000 |
| 2011 | $280,640,000 | 40.20% | $228,086,000 | 32.67% | $122,296,000 | 17.52% | $42,140,000 | 6.04% | $24,994,000 | 3.58% | $698,156,000 |
| 2012 | $268,354,000 | 37.67% | $213,281,000 | 29.94% | $163,147,000 | 22.90% | $42,820,000 | 6.01% | $24,846,000 | 3.49% | $712,448,000 |
| 2013 | $253,524,000 | 40.73% | $206,538,000 | 33.18% | $98,270,000 | 15.79% | $38,982,000 | 6.26% | $25,138,000 | 4.04% | $622,452,000 |
| Avg. | $251,071,429 | 50.29% | $167,046,048 | 32.70% | $67,892,571 | 11.24% | $15,087,571 | 2.56% | $17,140,667 | 3.21% | $518,238,286 |
Debt
The table below shows the amount of debt retired, issued, and outstanding in the district for each year.
| Debt | |||
|---|---|---|---|
| Fiscal Year |
Retired | Issued | Outstanding |
| Click [show] on the right to display the debt data for prior years. | |||
|---|---|---|---|
| 1993 | $7,899,000 | $0 | $35,247,000 |
| 1994 | $5,020,000 | $0 | $10,213,000 |
| 1995 | $1,991,000 | $0 | $8,222,000 |
| 1996 | $2,026,000 | $3,240,000 | $9,437,000 |
| 1997 | $53,205,000 | $45,775,000 | $124,880,000 |
| 1998 | $24,715,000 | $0 | $121,885,000 |
| 1999 | $25,170,000 | $0 | $82,995,000 |
| 2000 | $17,460,000 | $20,000,000 | $102,467,000 |
| 2001 | $31,892,000 | $151,745,000 | $200,450,000 |
| 2002 | $20,700,000 | $0 | $162,600,000 |
| 2003 | $12,795,000 | $0 | $272,005,000 |
| 2004 | $33,410,000 | $512,400,000 | $783,395,000 |
| 2005 | $32,400,000 | $39,312,000 | $824,851,000 |
| 2006 | $15,370,000 | $139,805,000 | $757,830,000 |
| 2007 | $464,050,000 | $501,310,000 | $795,090,000 |
| 2008 | $27,960,000 | $0 | $767,130,000 |
| 2009 | $33,395,000 | $0 | $733,735,000 |
| 2010 | $11,968,000 | $126,615,000 | $742,122,000 |
| 2011 | $34,215,000 | $3,000,000 | $714,255,000 |
| 2012 | $19,715,000 | $26,250,000 | $720,790,000 |
| 2013 | $27,250,000 | $0 | $693,540,000 |
| Avg. | $42,981,238 | $74,735,810 | $412,530,429 |
Teacher salaries
Teachers in Cincinnati Public Schools earn annual salaries based on years on the job as well as educational achievement. The district pays a minimum annual salary of $39,262 for teachers with Bachelor's degrees and $42,937 for Master's holders. The 2011-2012 salary schedule capped salaries at $60,714 for Bachelor's holders and $77,377 for teachers with Master's degrees. The maximum salary caps annual pay increases after 30 years of service in the district.[10]
Schools in district
Cincinnati Public Schools operates 55 K-12 schools listed below in alphabetical order:[11]
| Cincinnati Public Schools |
|---|
| Academy of Multilingual Immersion Studies |
| Academy of World Languages |
| Aiken High School |
| Bond Hill Academy |
| Carpe Diem Charter School |
| Carson School |
| Chase School |
| Cheviot School |
| Clark Montessori High School |
| College Hill Fundamental Academy |
| Covedale School |
| Dater High School |
| Dater Montessori School |
| Douglass School |
| Evanston Academy |
| Fairview-Clifton German Language School |
| Gamble Montessori High School |
| Hartwell School |
| Hays-Porter School |
| Hughes STEM High School |
| Hyde Park School |
| Kilgour School |
| Midway School |
| Mt. Airy School |
| Mt. Washington School |
| North Avondale Montessori School |
| Oyler School |
| Parker School |
| Parker Woods Montessori School |
| Pleasant Hill Academy |
| Pleasant Ridge Montessori School |
| Price Academy |
| Riverview East Academy |
| Roberts Paideia Academy |
| Rockdale Academy |
| Roll Hill Academy |
| Roselawn Condon School |
| Rothenberg Preparatory Academy |
| Sands Montessori School |
| Sayler Park School |
| School for Creative and Performing Arts |
| Shroder High School |
| Silverton Paideia Academy |
| South Avondale School |
| Taft Information Technology High School |
| Taft School |
| Taylor Academy |
| Virtual High School |
| Walnut Hills High School |
| Western Hills University |
| Westwood School |
| Winton Hills Academy |
| Withrow University High School |
| Woodford Paideia Academy |
| Woodward Career Technical High School |
Academic performance
The Ohio Department of Education issues an annual report card for each district based on scores from the Ohio Achievement Assessments. This testing process assesses the proficiency of students in grades 3 through 8 in reading and mathematics. Students in grades 10 and 11 complete the Ohio Graduation Test to not only assess proficiency but demonstrate readiness for postgraduate life.[12][13]
Cincinnati Public Schools received a C on the state's Performance Index and an F in the Indicators Met section. The Ohio Department of Education found that 66.3% of students qualified as Proficient or higher. The district met proficiency levels in 45.8% of performance indicators from grades 3 through 11. The following tables detail results from the Performance Index and Indicators Met sections in the 2012-2013 district report card.[14]
| Performance Index, 2012-2013 | |
|---|---|
| Performance level | Percentage of students (%) |
| Advanced Plus | - |
| Advanced | 14.8 |
| Accelerated | 19.1 |
| Proficient | 32.4 |
| Basic | 21.1 |
| Limited | 12 |
| Untested | 0.5 |
|
| ||||||||||||||||||||||||||||||||||||||||||||||||||||||||||||||||
Issues
Settlement with COAST
District officials agreed to a settlement with the Coalition Opposed to Additional Spending and Taxes (COAST) related to employee involvement in a 2012 tax levy vote. COAST and Cincinnati Public Schools agreed in 2002 that the district could not allow school resources or employees to be actively involved in local elections. The group claimed that the district broke this agreement by allowing employees to advocate for a tax levy renewal in 2012. The settlement requires the district to pay COAST $120,612 to cover legal fees and would find Cincinnati Public Schools in contempt of court if they break the 2002 agreement in the future.[15]
Emery Center complaint
The district filed a complaint with the Ohio Department of Taxation against the Emery Center in an effort to remove the building's tax-exempt status. The Emery Center located within district boundaries has not paid taxes since the University of Cincinnati leased the building for educational purposes since 1999. District officials are concerned that the Emery Center is not used for educational purposes and the tax exemption prevents revenue from supporting local schools. The district would receive about $130,000 per year in property taxes if the exemption is lifted by state officials.[16]
Contact information
![]()
Cincinnati Public Schools
Office of the Board Members
P.O. Box 5381
Cincinnati, OH 45201-5381
Phone: (513) 363-0040
Email: davisph@cps-k12.org
Website evaluation
| Taxes | |
| Budget | |
| Meetings | |
| Elected Officials | |
| Administrative Officials | |
| Contracts | |
| Audits | |
| Public Records | |
| Academics | |
| Background Checks | |
 | |
| Transparency grading process | |
- Main article: Evaluation of Ohio school district websites
Last rated on January 23, 2012
The good
- Board of Education members are published.[17]
- The Board of Education policies are published.[8]
- Board meetings and minutes are published as is information for viewing meetings on TV.[18]
- Administrative officials are published.[19]
- The budget is published.[20]
- Audits are published.[21]
- Current contract bids are published.[22]
- School District Report Card is published.[14]
- Performance Index is published.[23]
- The homepage has a number of useful resources including news, upcoming events, dashboard link and facebook, twitter, youtube and tv links.[24]
The bad
- Meeting agendas not posted.
- No public records.
- No background information.
- The search function is not working properly.
- No salary information.
See also
External links
References
- ↑ Ohio Department of Education, "Enrollment Data," accessed September 9, 2013
- ↑ Cincinnati Public Schools, "History," accessed September 12, 2013
- ↑ 3.0 3.1 3.2 U.S. Census, "Quick Facts: Cincinnati," accessed September 13, 2013
- ↑ Hamilton County Board of Elections, "Election Results," accessed September 13, 2013
- ↑ Smart Voter, "President Contests for Hamilton County," accessed September 13, 2013
- ↑ Cincinnati Public Schools, "Superintendent Mary Ronan," accessed September 12, 2013
- ↑ State Treasurer of Ohio, " Teacher and Education Employee Pay," accessed September 12, 2013
- ↑ 8.0 8.1 Cincinnati Public Schools, "Board Policies," accessed September 13, 2013
- ↑ United States Census Bureau, "Public School System Finances: Historical Data," accessed December 1, 2015
- ↑ Ohio Education Association, "Salary Data since 2001," accessed September 13, 2013
- ↑ Cincinnati Public Schools, "Find a School," accessed September 13, 2013
- ↑ Ohio Department of Education, "FAQs," accessed September 10, 2013
- ↑ Ohio Department of Education, "Ohio Graduation Test," accessed September 10, 2013
- ↑ 14.0 14.1 Ohio Department of Education, "2012-2013 Report Card for Cincinnati Public Schools," accessed September 12, 2013
- ↑ The Alliance Review, "Ohio school district settles anti-tax group lawsuit," September 12, 2013
- ↑ Cincinnati Business Courier, "Cincinnati Public Schools to Ohio: Make Emery pay taxes," September 11, 2013
- ↑ Cincinnati Public Schools, "Board of Education," accessed September 13, 2013
- ↑ Cincinnati Public Schools, "Board Minutes," accessed September 13, 2013
- ↑ Cincinnati Public Schools, "Administration," accessed September 13, 2013
- ↑ Cincinnati Public Schools, "Financial Information," accessed September 13, 2013
- ↑ Cincinnati Public Schools, "Auditor," accessed September 13, 2013
- ↑ Cincinnati Public Schools, "Doing Business with CPS," accessed September 13, 2013
- ↑ Cincinnati Public Schools, "Academics," accessed September 13, 2013
- ↑ Cincinnati Public Schools, "Home," accessed September 13, 2013