Colorado's 5th Congressional District
| Colorado's 5th Congressional District |
|---|
 |
| Incumbent Doug Lamborn Cook Partisan Voter Index (2018): R+14 |
| U.S. Census Bureau (2010 data)[1] |
| Population: 733,850 |
| Gender: 50.7% Male, 49.3% Female |
| Race[2]: 82.7% White, 5.6% Black, 2.5% Asian |
| Ethnicity: 14.8% Hispanic |
| Unemployment: 11.0% |
| Median household income $53,691 |
| High school graduation rate 93.1% |
| College graduation rate 33.9% |
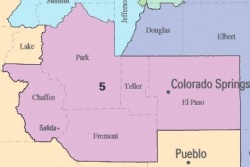
As of the 2010 redistricting cycle, Colorado's 5th Congressional District was located in central Colorado and included Chaffee, El Paso, Fremont, and Teller counties. Portions of Park County were also located within the district.[3]
The current representative of the 5th Congressional District is Doug Lamborn (R).
Elections
2020
General election candidates
- Doug Lamborn (Incumbent) (Republican Party) ✔
- Jillian Freeland (Democratic Party)

- Ed Duffett (Libertarian Party)
- Rebecca Keltie (Unity Party)
- Marcus Murphy (Independent)
Did not make the ballot:
- Doug Lunde (Libertarian Party)
![]() = candidate completed Ballotpedia's Candidate Connection survey
= candidate completed Ballotpedia's Candidate Connection survey
![]() Democratic primary candidates
Democratic primary candidates
Did not make the ballot:
![]() = candidate completed Ballotpedia's Candidate Connection survey
= candidate completed Ballotpedia's Candidate Connection survey![]() Republican primary candidates
Republican primary candidates
- Doug Lamborn (Incumbent) ✔
Unity Party primary convention
Rebecca Keltie advanced from the Unity Party primary convention on April 4, 2020.
2018
General election
General election for U.S. House Colorado District 5
Incumbent Doug Lamborn defeated Stephany Rose Spaulding and Douglas Randall in the general election for U.S. House Colorado District 5 on November 6, 2018.
Candidate | % | Votes | ||
| ✔ |  | Doug Lamborn (R) | 57.0 | 184,002 |
 | Stephany Rose Spaulding (D) | 39.3 | 126,848 | |
| Douglas Randall (L) | 3.7 | 11,795 | ||
| Other/Write-in votes | 0.0 | 71 | ||

| Total votes: 322,716 (100.00% precincts reporting) | |||
| If you are a candidate and would like to tell readers and voters more about why they should vote for you, complete the Ballotpedia Candidate Connection Survey. | ||||
Do you want a spreadsheet of this type of data? Contact our sales team. | ||||
Democratic primary election
Democratic primary for U.S. House Colorado District 5
Stephany Rose Spaulding advanced from the Democratic primary for U.S. House Colorado District 5 on June 26, 2018.
Candidate | % | Votes | ||
| ✔ | | Stephany Rose Spaulding | 100.0 | 45,466 |
| Total votes: 45,466 | |||
| If you are a candidate and would like to tell readers and voters more about why they should vote for you, complete the Ballotpedia Candidate Connection Survey. | ||||
Do you want a spreadsheet of this type of data? Contact our sales team. | ||||
Withdrawn or disqualified candidates
- Betty Field (D)
Republican primary election
Republican primary for U.S. House Colorado District 5
Incumbent Doug Lamborn defeated Darryl Glenn, Owen Hill, Bill Rhea, and Tyler Stevens in the Republican primary for U.S. House Colorado District 5 on June 26, 2018.
Candidate | % | Votes | ||
| ✔ | | Doug Lamborn | 52.2 | 54,974 |
 | Darryl Glenn | 20.4 | 21,479 | |
 | Owen Hill | 18.2 | 19,141 | |
 | Bill Rhea | 5.9 | 6,167 | |
| Tyler Stevens | 3.5 | 3,643 | ||
| Total votes: 105,404 | |||
| If you are a candidate and would like to tell readers and voters more about why they should vote for you, complete the Ballotpedia Candidate Connection Survey. | ||||
Do you want a spreadsheet of this type of data? Contact our sales team. | ||||
2016
Heading into the election, Ballotpedia rated this race as safely Republican. Incumbent Doug Lamborn (R) defeated Misty Plowright (D), Mike McRedmond (L), and Curtis Imrie (Write-in) in the general election on November 8, 2016. Lamborn defeated Calandra Vargas in the Republican primary, while Plowright defeated Donald Martinez to win the Democratic nomination. The primary elections took place on June 28, 2016.[4][5][6]
| Party | Candidate | Vote % | Votes | |
|---|---|---|---|---|
| Republican | 62.3% | 225,445 | ||
| Democratic | Misty Plowright | 30.9% | 111,676 | |
| Libertarian | Mike McRedmond | 6.9% | 24,872 | |
| Total Votes | 361,993 | |||
| Source: Colorado Secretary of State | ||||
| Candidate | Vote % | Votes | ||
|---|---|---|---|---|
|
|
68% | 51,018 | ||
| Calandra Vargas | 32% | 23,968 | ||
| Total Votes | 74,986 | |||
| Source: Colorado Secretary of State |
||||
| Candidate | Vote % | Votes | ||
|---|---|---|---|---|
|
|
58.1% | 13,419 | ||
| Donald Martinez | 41.9% | 9,658 | ||
| Total Votes | 23,077 | |||
| Source: Colorado Secretary of State |
||||
2014
The 5th Congressional District of Colorado held an election for the U.S. House of Representatives on November 4, 2014. Incumbent Doug Lamborn (R) defeated Irv Halter (D) in the general election.
| Party | Candidate | Vote % | Votes | |
|---|---|---|---|---|
| Republican | 59.8% | 157,182 | ||
| Democratic | Irv Halter | 40.2% | 105,673 | |
| Total Votes | 262,855 | |||
| Source: Colorado Secretary of State | ||||
2012
The 5th Congressional District of Colorado held an election for the U.S. House of Representatives on November 6, 2012. Incumbent Doug Lamborn won re-election in the district.[7]
| Party | Candidate | Vote % | Votes | |
|---|---|---|---|---|
| Republican | 65% | 199,639 | ||
| Libertarian | Jim Pirtle | 7.4% | 22,778 | |
| Independent | Dave Anderson | 17.4% | 53,318 | |
| Green | Misha Luzov | 6% | 18,284 | |
| Constitution | Kenneth R. Harvell | 4.3% | 13,212 | |
| Total Votes | 307,231 | |||
| Source: Colorado Secretary of State "Official Election Results, 2012 General Election" | ||||
2010
On November 2, 2010, Doug Lamborn won re-election to the United States House. He defeated Kevin Bradley (D), Brian Scott (American Constitution) and Jerell Klaver (L) in the general election.[8]
| U.S. House, Colorado District 5 General Election, 2010 | ||||
|---|---|---|---|---|
| Party | Candidate | Vote % | Votes | |
| Republican | 65.8% | 152,829 | ||
| Democratic | Kevin Bradley | 29.3% | 68,039 | |
| American Constitution | Brian Scott | 2.5% | 5,886 | |
| Libertarian | Jerell Klaver | 2.4% | 5,680 | |
| Total Votes | 232,434 | |||
2008
On November 4, 2008, Doug Lamborn won re-election to the United States House. He defeated Hal Bidlack (D), Brian Scott (American Constitution) and Rich Hand (Write-in) in the general election.[9]
| U.S. House, Colorado District 5 General Election, 2008 | ||||
|---|---|---|---|---|
| Party | Candidate | Vote % | Votes | |
| Republican | 60% | 183,178 | ||
| Democratic | Hal Bidlack | 37% | 113,025 | |
| American Constitution | Brian Scott | 2.9% | 8,894 | |
| Write-in | Rich Hand | 0% | 45 | |
| Total Votes | 305,142 | |||
2006
On November 7, 2006, Doug Lamborn won election to the United States House. He defeated Jay Fawcett (D) and Write-in candidates Richard Hand, Brian Scott and Gregory Hollister in the general election.[10]
| U.S. House, Colorado District 5 General Election, 2006 | ||||
|---|---|---|---|---|
| Party | Candidate | Vote % | Votes | |
| Republican | 59.6% | 123,264 | ||
| Democratic | Jay Fawcett | 40.4% | 83,431 | |
| Write-in | Richard Hand | 0% | 41 | |
| Write-in | Brian Scott | 0% | 12 | |
| Write-in | Gregory Hollister | 0% | 8 | |
| Total Votes | 206,756 | |||
2004
On November 2, 2004, Joel Hefley won re-election to the United States House. He defeated Fred Hardee (D) and Arthur Roberts (L) in the general election.[11]
| U.S. House, Colorado District 5 General Election, 2004 | ||||
|---|---|---|---|---|
| Party | Candidate | Vote % | Votes | |
| Republican | 70.5% | 193,333 | ||
| Democratic | Fred Hardee | 27% | 74,098 | |
| Libertarian | Arthur Roberts | 2.4% | 6,627 | |
| Total Votes | 274,058 | |||
2002
On November 5, 2002, Joel Hefley won re-election to the United States House. He defeated Curtis Imrie (D) and Biff Baker (L) in the general election.[12]
| U.S. House, Colorado District 5 General Election, 2002 | ||||
|---|---|---|---|---|
| Party | Candidate | Vote % | Votes | |
| Republican | 69.4% | 128,118 | ||
| Democratic | Curtis Imrie | 24.7% | 45,587 | |
| Libertarian | Biff Baker | 5.9% | 10,972 | |
| Total Votes | 184,677 | |||
2000
On November 7, 2000, Joel Hefley won re-election to the United States House. He defeated Kerry Kantor (L) and Randy MacKenzie (Natural Law) in the general election.[13]
| U.S. House, Colorado District 5 General Election, 2000 | ||||
|---|---|---|---|---|
| Party | Candidate | Vote % | Votes | |
| Republican | 82.7% | 253,330 | ||
| Libertarian | Kerry Kantor | 12.3% | 37,719 | |
| Natural Law | Randy MacKenzie | 5% | 15,260 | |
| Total Votes | 306,309 | |||
1998
On November 3, 1998, Joel Hefley won re-election to the United States House. He defeated Ken Alford (D) and Mark Mellot (Natural Law) in the general election.[14]
| U.S. House, Colorado District 5 General Election, 1998 | ||||
|---|---|---|---|---|
| Party | Candidate | Vote % | Votes | |
| Republican | 72.7% | 155,790 | ||
| Democratic | Ken Alford | 26% | 55,609 | |
| Natural Law | Mark Mellot | 1.3% | 2,871 | |
| Total Votes | 214,270 | |||
1996
On November 5, 1996, Joel Hefley won re-election to the United States House. He defeated Mike Robinson (D) in the general election.[15]
| U.S. House, Colorado District 5 General Election, 1996 | ||||
|---|---|---|---|---|
| Party | Candidate | Vote % | Votes | |
| Republican | 71.9% | 188,805 | ||
| Democratic | Mike Robinson | 28.1% | 73,660 | |
| Total Votes | 262,465 | |||
1994
On November 8, 1994, Joel Hefley won re-election to the United States House. He ran unopposed in the general election.[16]
| U.S. House, Colorado District 5 General Election, 1994 | ||||
|---|---|---|---|---|
| Party | Candidate | Vote % | Votes | |
| Republican | 100% | 138,674 | ||
| Total Votes | 138,674 | |||
1992
On November 3, 1992, Joel Hefley won re-election to the United States House. He defeated Charles Oriez (D) and Keith Hamburger (L) in the general election.[17]
| U.S. House, Colorado District 5 General Election, 1992 | ||||
|---|---|---|---|---|
| Party | Candidate | Vote % | Votes | |
| Republican | 71.1% | 173,096 | ||
| Democratic | Charles Oriez | 25.7% | 62,550 | |
| Libertarian | Keith Hamburger | 3.2% | 7,769 | |
| Total Votes | 243,415 | |||
1990
On November 6, 1990, Joel Hefley won re-election to the United States House. He defeated Cal Johnston (D) and Keith Hamburger (L) in the general election.[18]
| U.S. House, Colorado District 5 General Election, 1990 | ||||
|---|---|---|---|---|
| Party | Candidate | Vote % | Votes | |
| Republican | 66.4% | 127,740 | ||
| Democratic | Cal Johnston | 30% | 57,776 | |
| Colorado Libertarian | Keith Hamburger | 3.5% | 6,761 | |
| Total Votes | 192,277 | |||
Redistricting
2010-2011

- See also: Redistricting in Colorado
In 2011, the Colorado State Legislature re-drew the congressional districts based on updated population information from the 2010 census.
District analysis
- See also: The Cook Political Report's Partisan Voter Index
- See also: FiveThirtyEight's elasticity scores
The 2017 Cook Partisan Voter Index for this district was R+14, meaning that in the previous two presidential elections, this district's results were 14 percentage points more Republican than the national average. This made Colorado's 5th Congressional District the 95th most Republican nationally.[19]
FiveThirtyEight's September 2018 elasticity score for states and congressional districts measured "how sensitive it is to changes in the national political environment." This district's elasticity score was 1.11. This means that for every 1 point the national political mood moved toward a party, the district was expected to move 1.11 points toward that party.[20]
See also
External links
Footnotes
- ↑ Demographic data were added to this page in 2013. Ballotpedia will update this page in 2021 after data from the 2020 Census become available.
- ↑ Note: Percentages for race and ethnicity may add up to more than 100 percent because respondents may report more than one race and the Hispanic/Latino ethnicity may be selected in conjunction with any race. Read more about race and ethnicity in the census here.
- ↑ United States Census Bureau, "Counties by Congressional Districts," accessed June 8, 2016
- ↑ Colorado Secretary of State, "2016 Primary Election Candidate List," accessed May 2, 2016
- ↑ Politico, "Colorado House Primaries Results," June 28, 2016
- ↑ Colorado Secretary of State, "2016 General Election Candidate List," accessed September 5, 2016
- ↑ Politico, "2012 Election Map, Colorado," November 6, 2012
- ↑ U.S. Congress House Clerk, "Statistics of the Congressional Election of November 2, 2010," accessed March 28, 2013
- ↑ U.S. Congress House Clerk, "Statistics of the Congressional Election of November 4, 2008," accessed March 28, 2013
- ↑ U.S. Congress House Clerk, "Statistics of the Congressional Election of November 7, 2006," accessed March 28, 2013
- ↑ U.S. Congress House Clerk, "Statistics of the Congressional Election of November 2, 2004," accessed March 28, 2013
- ↑ U.S. Congress House Clerk, "Statistics of the Congressional Election of November 5, 2002," accessed March 28, 2013
- ↑ U.S. Congress House Clerk, "Statistics of the Congressional Election of November 7, 2000," accessed March 28, 2013
- ↑ U.S. Congress House Clerk, "Statistics of the Congressional Election of November 3, 1998," accessed March 28, 2013
- ↑ U.S. Congress House Clerk, "Statistics of the Congressional Election of November 5, 1996," accessed March 28, 2013
- ↑ U.S. Congress House Clerk, "Statistics of the Congressional Election of November 8, 1994," accessed March 28, 2013
- ↑ U.S. Congress House Clerk, "Statistics of the Congressional Election of November 3, 1992," accessed March 28, 2013
- ↑ U.S. Congress House Clerk, "Statistics of the Congressional Election of November 6, 1990," accessed March 28, 2013
- ↑ Cook Political Report, "Introducing the 2017 Cook Political Report Partisan Voter Index," April 7, 2017
- ↑ FiveThirtyEight, "Election Update: The Most (And Least) Elastic States And Districts," September 6, 2018