Cincinnati Public Schools, Ohio
| Cincinnati Public Schools |
|---|
| Cincinnati, Ohio |
| District details |
| Superintendent: Laura Mitchell |
| # of school board members: 7 |
| Website: Link |
The Cincinnati Public Schools is a school district in Ohio. It was the third-largest school district in the state in the 2014-2015 school year and served 32,444 students.[1]
About the district
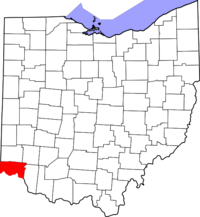
Cincinnati Public Schools is located in southwestern Ohio in Hamilton County. The county seat is Cincinnati. The county was home to an estimated 809,099 residents from 2010 to 2016, according to the United States Census Bureau.[2]
Demographics
Hamilton County overperformed in comparison to the rest of Ohio in terms of higher education achievement from 2011 to 2015. The United States Census Bureau found that 35.0 percent of county residents aged 25 years and older had attained a bachelor's degree, compared to 26.1 percent of state residents. The median household income in Hamilton County was $49,013, while it was $49,429 for Ohio. The county poverty rate was 16.6 percent, compared to the state's 14.6 percent.[2]
| Racial Demographics, 2010-2016[2] | ||
|---|---|---|
| Race | Hamilton County (%) | Ohio (%) |
| White | 68.3 | 82.5 |
| Black or African American | 26.4 | 12.8 |
| American Indian and Alaska Native | 0.2 | 0.3 |
| Asian | 2.6 | 2.2 |
| Native Hawaiian and Other Pacific Islander | 0.1 | 0.1 |
| Two or More Races | 2.4 | 2.2 |
| Hispanic or Latino | 3.1 | 3.7 |
Note: Percentages for race and ethnicity may add up to more than 100 percent because respondents may report more than one race and the Hispanic/Latino ethnicity may be selected in conjunction with any race. Read more about race and ethnicity in the census here.
Superintendent
| |
This information is updated as we become aware of changes. Please contact us with any updates. |
Laura Mitchell is the superintendent of Cincinnati Public Schools. Mitchell was appointed superintendent on August 2017. Mitchell's previous career experience includes working as the district's deputy superintendent and chief academic officer.[3]
Past Superintendents
- Mary Ronan was the superintendent of Cincinnati Public Schools from 2009 to 2017. Ronan's previous career experience included working as the district's director of schools.[4]
School board elections
The Cincinnati Board of Education consists of seven members who are elected at large to four-year terms. Annual compensation for board members is determined when new members are sworn into office though members often donate compensation to a trust fund that covers board expenses. Each member can participate in the district's health and life insurance plans as well as the State Employees Retirement System.[5]
| Office | Name | Date assumed office |
|---|---|---|
| Cincinnati Board of Education At-large | Eve Bolton | 2008 |
| Cincinnati Board of Education At-large | Brandon Craig | January 1, 2022 |
| Cincinnati Board of Education At-large | Jim Crosset | August 5, 2024 |
| Cincinnati Board of Education At-large | Ben Lindy | January 6, 2020 |
| Cincinnati Board of Education At-large | Kendra Mapp | January 1, 2024 |
| Cincinnati Board of Education At-large | Kareem Moffett | January 1, 2022 |
| Cincinnati Board of Education At-large | Mary Wineberg | January 1, 2022 |
| |
This officeholder information was last updated on February 3, 2021. Please contact us with any updates. | |
Election dates
Members of the Cincinnati Board of Education are elected at large to four-year terms on a staggered basis.
Four seats on the board were up for general election on November 2, 2021.
Budget
From 1993 to 2013, the Cincinnati school district had an average of $500,685,238 in revenue and $518,238,286 in expenditures, according to the United States Census Bureau's survey of school system finances. The district had a yearly average of $412,530,429 in outstanding debt. The district retired $42,981,238 of its debt and issued $74,735,810 in new debt each year on average.[6]
Revenue
The table below separates the district's revenue into the three sources identified by the agency: local, state, and federal.
| Revenue by Source | |||||||||||
|---|---|---|---|---|---|---|---|---|---|---|---|
| Fiscal Year |
Local | State | Federal | Revenue Total | |||||||
| Total | % of Revenue | Total | % of Revenue | Total | % of Revenue | ||||||
| Click [show] on the right to display the revenue data for prior years. | |||||||||||
|---|---|---|---|---|---|---|---|---|---|---|---|
| 1993 | $202,086,000 | 55.88% | $130,458,000 | 36.07% | $29,109,000 | 8.05% | $361,653,000 | ||||
| 1994 | $200,007,000 | 56.35% | $125,721,000 | 35.42% | $29,200,000 | 8.23% | $354,928,000 | ||||
| 1995 | $192,575,000 | 53.38% | $122,397,000 | 33.93% | $45,784,000 | 12.69% | $360,756,000 | ||||
| 1996 | $165,922,000 | 47.95% | $137,657,000 | 39.78% | $42,455,000 | 12.27% | $346,034,000 | ||||
| 1997 | $217,642,000 | 53.86% | $142,678,000 | 35.31% | $43,795,000 | 10.84% | $404,115,000 | ||||
| 1998 | $224,597,000 | 53.78% | $151,113,000 | 36.18% | $41,905,000 | 10.03% | $417,615,000 | ||||
| 1999 | $232,930,000 | 52.98% | $167,851,000 | 38.18% | $38,897,000 | 8.85% | $439,678,000 | ||||
| 2000 | $228,731,000 | 51.86% | $168,267,000 | 38.15% | $44,025,000 | 9.98% | $441,023,000 | ||||
| 2001 | $257,215,000 | 54.68% | $172,634,000 | 36.70% | $40,546,000 | 8.62% | $470,395,000 | ||||
| 2002 | $269,498,000 | 55.81% | $165,984,000 | 34.37% | $47,409,000 | 9.82% | $482,891,000 | ||||
| 2003 | $276,030,000 | 57.09% | $157,823,000 | 32.64% | $49,675,000 | 10.27% | $483,528,000 | ||||
| 2004 | $263,131,000 | 52.95% | $171,244,000 | 34.46% | $62,524,000 | 12.58% | $496,899,000 | ||||
| 2005 | $258,571,000 | 47.23% | $219,507,000 | 40.10% | $69,374,000 | 12.67% | $547,452,000 | ||||
| 2006 | $284,356,000 | 52.45% | $191,167,000 | 35.26% | $66,585,000 | 12.28% | $542,108,000 | ||||
| 2007 | $291,086,000 | 51.79% | $204,159,000 | 36.32% | $66,827,000 | 11.89% | $562,072,000 | ||||
| 2008 | $330,463,000 | 53.60% | $218,730,000 | 35.47% | $67,383,000 | 10.93% | $616,576,000 | ||||
| 2009 | $300,493,000 | 48.47% | $252,351,000 | 40.70% | $67,134,000 | 10.83% | $619,978,000 | ||||
| 2010 | $344,481,000 | 50.85% | $235,521,000 | 34.77% | $97,408,000 | 14.38% | $677,410,000 |
| 2011 | $313,498,000 | 46.71% | $246,085,000 | 36.67% | $111,577,000 | 16.62% | $671,160,000 |
| 2012 | $318,198,000 | 52.01% | $213,261,000 | 34.86% | $80,388,000 | 13.14% | $611,847,000 |
| 2013 | $328,933,000 | 54.26% | $205,158,000 | 33.84% | $72,181,000 | 11.91% | $606,272,000 |
| Avg. | $261,925,857 | 52.57% | $180,941,238 | 36.15% | $57,818,143 | 11.28% | $500,685,238 |
Expenditures
The table below separates the district's expenditures into five categories identified by the agency:
- Instruction: operation expenditures, state payments on behalf of the district for instruction and benefits, and retirement system transfers
- Support Services: support services, food services, and retirement system transfers for support service staff
- Capital Spending: capital outlay expenditures (i.e., construction, land or facilities purchases, and equipment purchases)
- Debt & Gov. Payments: payments to state and local governments and interest on school system debt
- Other: all other non-K-12 programs, except food services
| Expenditures by Category | |||||||||||
|---|---|---|---|---|---|---|---|---|---|---|---|
| Fiscal Year |
Instruction | Support Services | Capital Spending | Debt & Gov. Payments | Other | Budget Total | |||||
| Total | % of Budget | Total | % of Budget | Total | % of Budget | Total | % of Budget | Total | % of Budget | ||
| Click [show] on the right to display the expenditure data for prior years. | |||||||||||
|---|---|---|---|---|---|---|---|---|---|---|---|
| 1993 | $202,000,000 | 58.39% | $129,897,000 | 37.55% | $9,541,000 | 2.76% | $4,412,000 | 1.28% | $86,000 | 0.02% | $345,936,000 |
| 1994 | $203,525,000 | 58.24% | $133,700,000 | 38.26% | $4,612,000 | 1.32% | $4,982,000 | 1.43% | $2,643,000 | 0.76% | $349,462,000 |
| 1995 | $207,355,000 | 56.84% | $129,793,000 | 35.58% | $21,928,000 | 6.01% | $1,039,000 | 0.28% | $4,713,000 | 1.29% | $364,828,000 |
| 1996 | $206,256,000 | 60.01% | $113,376,000 | 32.99% | $14,869,000 | 4.33% | $411,000 | 0.12% | $8,790,000 | 2.56% | $343,702,000 |
| 1997 | $209,793,000 | 56.42% | $123,943,000 | 33.33% | $13,950,000 | 3.75% | $7,207,000 | 1.94% | $16,965,000 | 4.56% | $371,858,000 |
| 1998 | $219,770,000 | 56.39% | $130,237,000 | 33.41% | $16,442,000 | 4.22% | $7,958,000 | 2.04% | $15,359,000 | 3.94% | $389,766,000 |
| 1999 | $230,057,000 | 57.66% | $128,545,000 | 32.22% | $15,904,000 | 3.99% | $7,530,000 | 1.89% | $16,934,000 | 4.24% | $398,970,000 |
| 2000 | $217,607,000 | 53.25% | $136,866,000 | 33.49% | $22,547,000 | 5.52% | $13,458,000 | 3.29% | $18,148,000 | 4.44% | $408,626,000 |
| 2001 | $239,449,000 | 55.60% | $149,478,000 | 34.71% | $20,333,000 | 4.72% | $6,141,000 | 1.43% | $15,273,000 | 3.55% | $430,674,000 |
| 2002 | $270,649,000 | 55.97% | $146,358,000 | 30.27% | $37,280,000 | 7.71% | $9,289,000 | 1.92% | $20,009,000 | 4.14% | $483,585,000 |
| 2003 | $275,218,000 | 54.12% | $164,734,000 | 32.40% | $34,157,000 | 6.72% | $12,080,000 | 2.38% | $22,327,000 | 4.39% | $508,516,000 |
| 2004 | $290,085,000 | 53.38% | $189,022,000 | 34.78% | $46,847,000 | 8.62% | $1,315,000 | 0.24% | $16,170,000 | 2.98% | $543,439,000 |
| 2005 | $293,921,000 | 45.79% | $197,555,000 | 30.78% | $133,816,000 | 20.85% | $951,000 | 0.15% | $15,626,000 | 2.43% | $641,869,000 |
| 2006 | $282,875,000 | 47.21% | $184,808,000 | 30.84% | $113,274,000 | 18.90% | $878,000 | 0.15% | $17,343,000 | 2.89% | $599,178,000 |
| 2007 | $275,357,000 | 44.01% | $197,426,000 | 31.56% | $132,894,000 | 21.24% | $123,000 | 0.02% | $19,829,000 | 3.17% | $625,629,000 |
| 2008 | $274,636,000 | 40.87% | $193,690,000 | 28.82% | $138,316,000 | 20.58% | $40,098,000 | 5.97% | $25,271,000 | 3.76% | $672,011,000 |
| 2009 | $278,726,000 | 41.34% | $203,814,000 | 30.23% | $127,921,000 | 18.97% | $38,779,000 | 5.75% | $24,921,000 | 3.70% | $674,161,000 |
| 2010 | $292,703,000 | 41.95% | $206,820,000 | 29.64% | $137,400,000 | 19.69% | $36,246,000 | 5.19% | $24,569,000 | 3.52% | $697,738,000 |
| 2011 | $280,640,000 | 40.20% | $228,086,000 | 32.67% | $122,296,000 | 17.52% | $42,140,000 | 6.04% | $24,994,000 | 3.58% | $698,156,000 |
| 2012 | $268,354,000 | 37.67% | $213,281,000 | 29.94% | $163,147,000 | 22.90% | $42,820,000 | 6.01% | $24,846,000 | 3.49% | $712,448,000 |
| 2013 | $253,524,000 | 40.73% | $206,538,000 | 33.18% | $98,270,000 | 15.79% | $38,982,000 | 6.26% | $25,138,000 | 4.04% | $622,452,000 |
| Avg. | $251,071,429 | 50.29% | $167,046,048 | 32.70% | $67,892,571 | 11.24% | $15,087,571 | 2.56% | $17,140,667 | 3.21% | $518,238,286 |
Debt
The table below shows the amount of debt retired, issued, and outstanding in the district for each year.
| Debt | |||
|---|---|---|---|
| Fiscal Year |
Retired | Issued | Outstanding |
| Click [show] on the right to display the debt data for prior years. | |||
|---|---|---|---|
| 1993 | $7,899,000 | $0 | $35,247,000 |
| 1994 | $5,020,000 | $0 | $10,213,000 |
| 1995 | $1,991,000 | $0 | $8,222,000 |
| 1996 | $2,026,000 | $3,240,000 | $9,437,000 |
| 1997 | $53,205,000 | $45,775,000 | $124,880,000 |
| 1998 | $24,715,000 | $0 | $121,885,000 |
| 1999 | $25,170,000 | $0 | $82,995,000 |
| 2000 | $17,460,000 | $20,000,000 | $102,467,000 |
| 2001 | $31,892,000 | $151,745,000 | $200,450,000 |
| 2002 | $20,700,000 | $0 | $162,600,000 |
| 2003 | $12,795,000 | $0 | $272,005,000 |
| 2004 | $33,410,000 | $512,400,000 | $783,395,000 |
| 2005 | $32,400,000 | $39,312,000 | $824,851,000 |
| 2006 | $15,370,000 | $139,805,000 | $757,830,000 |
| 2007 | $464,050,000 | $501,310,000 | $795,090,000 |
| 2008 | $27,960,000 | $0 | $767,130,000 |
| 2009 | $33,395,000 | $0 | $733,735,000 |
| 2010 | $11,968,000 | $126,615,000 | $742,122,000 |
| 2011 | $34,215,000 | $3,000,000 | $714,255,000 |
| 2012 | $19,715,000 | $26,250,000 | $720,790,000 |
| 2013 | $27,250,000 | $0 | $693,540,000 |
| Avg. | $42,981,238 | $74,735,810 | $412,530,429 |
Teacher salaries
Teachers in Cincinnati Public Schools earn annual salaries based on years on the job as well as educational achievement. The district pays a minimum annual salary of $39,262 for teachers with Bachelor's degrees and $42,937 for Master's holders. The 2011-2012 salary schedule capped salaries at $60,714 for Bachelor's holders and $77,377 for teachers with Master's degrees. The maximum salary caps annual pay increases after 30 years of service in the district.[7]
Schools in district
Cincinnati Public Schools operates 55 K-12 schools listed below in alphabetical order:[8]
| Cincinnati Public Schools |
|---|
| Academy of Multilingual Immersion Studies |
| Academy of World Languages |
| Aiken High School |
| Bond Hill Academy |
| Carpe Diem Charter School |
| Carson School |
| Chase School |
| Cheviot School |
| Clark Montessori High School |
| College Hill Fundamental Academy |
| Covedale School |
| Dater High School |
| Dater Montessori School |
| Douglass School |
| Evanston Academy |
| Fairview-Clifton German Language School |
| Gamble Montessori High School |
| Hartwell School |
| Hays-Porter School |
| Hughes STEM High School |
| Hyde Park School |
| Kilgour School |
| Midway School |
| Mt. Airy School |
| Mt. Washington School |
| North Avondale Montessori School |
| Oyler School |
| Parker School |
| Parker Woods Montessori School |
| Pleasant Hill Academy |
| Pleasant Ridge Montessori School |
| Price Academy |
| Riverview East Academy |
| Roberts Paideia Academy |
| Rockdale Academy |
| Roll Hill Academy |
| Roselawn Condon School |
| Rothenberg Preparatory Academy |
| Sands Montessori School |
| Sayler Park School |
| School for Creative and Performing Arts |
| Shroder High School |
| Silverton Paideia Academy |
| South Avondale School |
| Taft Information Technology High School |
| Taft School |
| Taylor Academy |
| Virtual High School |
| Walnut Hills High School |
| Western Hills University |
| Westwood School |
| Winton Hills Academy |
| Withrow University High School |
| Woodford Paideia Academy |
| Woodward Career Technical High School |
Academic performance
The Ohio Department of Education issues an annual report card for each district based on scores from the Ohio Achievement Assessments. This testing process assesses the proficiency of students in grades 3 through 8 in reading and mathematics. Students in grades 10 and 11 complete the Ohio Graduation Test to not only assess proficiency but demonstrate readiness for postgraduate life.[9][10]
Cincinnati Public Schools received a C on the state's Performance Index and an F in the Indicators Met section. The Ohio Department of Education found that 66.3% of students qualified as Proficient or higher. The district met proficiency levels in 45.8% of performance indicators from grades 3 through 11. The following tables detail results from the Performance Index and Indicators Met sections in the 2012-2013 district report card.[11]
| Performance Index, 2012-2013 | |
|---|---|
| Performance level | Percentage of students (%) |
| Advanced Plus | - |
| Advanced | 14.8 |
| Accelerated | 19.1 |
| Proficient | 32.4 |
| Basic | 21.1 |
| Limited | 12 |
| Untested | 0.5 |
|
| ||||||||||||||||||||||||||||||||||||||||||||||||||||||||||||||||
Issues
Settlement with COAST
District officials agreed to a settlement with the Coalition Opposed to Additional Spending and Taxes (COAST) related to employee involvement in a 2012 tax levy vote. COAST and Cincinnati Public Schools agreed in 2002 that the district could not allow school resources or employees to be actively involved in local elections. The group claimed that the district broke this agreement by allowing employees to advocate for a tax levy renewal in 2012. The settlement requires the district to pay COAST $120,612 to cover legal fees and would find Cincinnati Public Schools in contempt of court if they break the 2002 agreement in the future.[12]
Emery Center complaint
The district filed a complaint with the Ohio Department of Taxation against the Emery Center in an effort to remove the building's tax-exempt status. The Emery Center located within district boundaries has not paid taxes since the University of Cincinnati leased the building for educational purposes since 1999. District officials are concerned that the Emery Center is not used for educational purposes and the tax exemption prevents revenue from supporting local schools. The district would receive about $130,000 per year in property taxes if the exemption is lifted by state officials.[13]
Contact information
![]()
Cincinnati Public Schools
2651 Burnet Ave.
Cincinnati, OH 45219
Phone: (513) 363-0000
See also
| Ohio | School Board Elections | News and Analysis |
|---|---|---|
 |
 | |
External links
Footnotes
- ↑ U.S. Department of Education, National Center for Education Statistics, "Common Core of Data, file ccd_lea_052_1414_w_0216161a, 2014-2015," accessed November 16, 2016
- ↑ 2.0 2.1 2.2 United States Census Bureau, "Hamilton County, Ohio," accessed October 19, 2017
- ↑ Cincinnati Public Schools, "Superintendent Laura Mitchell," accessed October 19, 2017
- ↑ Cincinnati Public Schools, "Superintendent Mary Ronan," accessed September 12, 2013
- ↑ Cincinnati Public Schools, "Board Policies," accessed September 13, 2013
- ↑ United States Census Bureau, "Public School System Finances: Historical Data," accessed December 1, 2015
- ↑ Ohio Education Association, "Salary Data since 2001," accessed September 13, 2013
- ↑ Cincinnati Public Schools, "Find a School," accessed September 13, 2013
- ↑ Ohio Department of Education, "FAQs," accessed September 10, 2013
- ↑ Ohio Department of Education, "Ohio Graduation Test," accessed September 10, 2013
- ↑ Ohio Department of Education, "2012-2013 Report Card for Cincinnati Public Schools," accessed September 12, 2013
- ↑ The Alliance Review, "Ohio school district settles anti-tax group lawsuit," September 12, 2013
- ↑ Cincinnati Business Courier, "Cincinnati Public Schools to Ohio: Make Emery pay taxes," September 11, 2013