Scott Rasmussen's Number of the Day for August 3, 2017
The Number of the Day columns published on Ballotpedia reflect the views of the author.
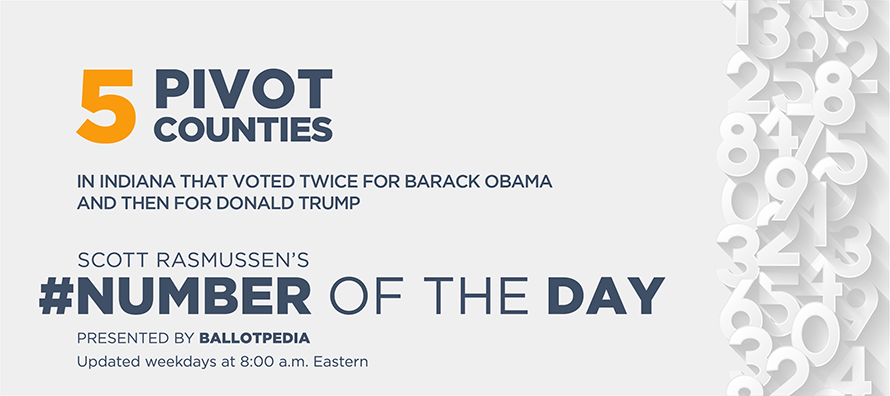
August 3, 2017: During the 2016 presidential election, Indiana was home to five of the nation’s 206 Pivot Counties—counties that voted twice for Barack Obama before voting for Donald Trump. Obama won Indiana’s Pivot Counties by 14 percentage points in 2008 and by 5 points in 2012. However, Trump carried these counties by 10 percentage points in 2016.
| Indiana Pivot Counties | 2016 | 2012 | 2008 |
|---|---|---|---|
| Republican | 51.6% | 46.3% | 42.2% |
| Democrat | 41.7% | 51.6% | 56.5% |
| Margin | R+9.9 | D+5.3 | D+14.3 |
Perhaps most notable among Indiana’s Pivot Counties is Vigo County, which has voted for the winning candidate in every election since 1956 and in all but two elections since the 1890s. As a result, Vigo is one of the true swing counties in the nation.
The other Indiana Pivot Counties are Delaware, Laporte, Perry, and Porter. This article is part of an ongoing Ballotpedia series that, until the 2018 election, will release new Pivot County data to explore what these counties can teach us about national trends and the midterm elections.
Indiana’s Joe Donnelly is one of 19 Democratic senators running for re-election in a state with Pivot Counties. However, his greater challenge might be the strong Republican lean of the entire state. During Election 2016, 57 percent of Indiana votes were cast in solidly Republican counties—and they had an even bigger impact on the election results.
In 2008, Obama defeated John McCain to win the Hoosiers’ Electoral College votes. Republicans have won the state in every other presidential election since 1964.
During 2016, Trump carried Indiana by a total of 524,160 votes. That’s nearly double the 268,597-vote victory earned by Mitt Romney in 2012. Seventy percent of the GOP gains came from the solid Republican counties. Thirteen percent came from Pivot Counties and 8 percent from declining Democratic margins in solidly Democratic counties.
| Indiana | Net vote change from 2012 to 2016 | % of net votes gained by GOP in 2016 | % of total votes cast in 2016 |
|---|---|---|---|
| Pivot | 32,652 | 12.8% | 7.9% |
| Solid GOP | 179,168 | 70.1% | 57.4% |
| Solid Dem | 19,426 | 7.6% | 26.8% |
| Other | 24,317 | 9.5% | 7.9% |
| Total | 255,563 | 100.0% | 100.0% |
In many states, including Iowa and Michigan, the Pivot Counties had an outsized impact on the results. In states like Pennsylvania and Ohio, increased margins in solidly Republican counties played a bigger role. In Wisconsin, the biggest impact came from counties that voted for Obama in 2008, Mitt Romney in 2012, and Trump in 2016. In Maine, nearly half of all voters live in Pivot Counties, and they helped Trump win one of the state’s Electoral College votes.
Nationally, there are 2,226 Solidly Republican Counties and 449 Solidly Democratic Counties.
The table below shows the Republican margins contributed by each type of county in the last three presidential elections.
| Indiana counties | 2016 | 2012 | 2008 |
|---|---|---|---|
| Pivot | 21,655 | -10,997 | -31,987 |
| Solid GOP | 600,955 | 421,787 | 238,316 |
| Solid Dem | -137,704 | -157,130 | -219,765 |
| Other | 39,254 | 14,937 | -14,955 |
| Total | 524,160 | 268,597 | -28,391 |
The map below highlights the different types of counties in Indiana:
Each weekday, Scott Rasmussen’s Number of the Day explores interesting and newsworthy topics at the intersection of culture, politics, and technology.
- August 2, 2017 – 86% of food service jobs at high risk of being automated by 2030
- August 1, 2017 – 4 U.S. presidents in last 100 years improved their party's electoral strength
- July 31, 2017 – 15% increase in top hospitals' revenue during first two years of Obamacare
- July 28, 2017 – 66 of the nation’s 100 largest cities allow homesharing with minimal regulation
- July 27, 2017 – 15 million Americans would opt out of Obamacare coverage if they could
- To see other recent numbers, check out the archive.
Scott Rasmussen’s Number of the Day is published by Ballotpedia weekdays at 8:00 a.m. Eastern. Click here to check out the latest update.
The Number of the Day is broadcast on local stations across the country. An archive of these broadcasts can be found here.
Columns published on Ballotpedia reflect the views of the author.
Ballotpedia is the nonprofit, nonpartisan Encyclopedia of American Politics.
See also
- Scott Rasmussen's Number of the Day
- Scott Rasmussen's Number of the Day - Elections
- Scott Rasmussen's Number of the Day for March 20, 2017
| |||||||||||||||||||||||


