Stevens Point Area School District elections (2018)
- General election: Nov. 6
- Voter registration deadline: Oct. 17 (online or mail), or Nov. 2 (in-person)
- Early voting: Varies by locality
- Absentee voting deadline: Nov. 6
- Online registration: Yes
- Same-day registration: Yes
- Voter ID: Photo ID required
- Poll times: 7:00 a.m. to 8:00 p.m.
2019 →
← 2017 |
|---|
|
|
| Enrollment ('15-'16) |
|
|
Three of the nine seats on the Stevens Point Area School District school board in Wisconsin were up for at-large general election on April 3, 2018. Incumbents Meg Erler, Judy Rannow, and Mike Wade defeated former member Alex Kochanowski for the at-large seats.[1][2]
With three incumbents and one challenger on the ballot, at least two incumbents were guaranteed to win re-election in 2018. From 2014 to 2017, the incumbent success rate in the district ranged between 50 and 100 percent. Click here for more election trends in the district.
Elections
Voter and candidate information

The Stevens Point Area school board consists of nine members elected to three-year terms on a staggered basis. All members are elected at large, and elections are held every year.[3]
School board candidates in Wisconsin had to be U.S. citizens, at least 18 years old, and residents of the school district for a minimum of 28 consecutive days before filing as a candidate. They also could not be disqualified from voting under Wisconsin law.[4]
To get on the ballot, school board candidates had to file nomination papers with the school district clerk by January 2, 2018. If incumbents whose terms were up for re-election did not file to run in the race and did not file written notification that they would not be running, the candidate filing deadline could have been extended until January 5, 2018. The terms of candidates elected in the race started on April 23, 2018.[4]
Voter registration
- See also: Voting in Wisconsin and Voter identification laws by state
To vote in Wisconsin, one must be a citizen of the United States and a resident of the state for at least 10 days prior to the election. A voter must be at least 18 years old.[5][6][7] One can register to vote by mail, online, or in person. For voters registering to vote in this 2018 school board election by mail, the application had to be postmarked by March 14, 2018. The online voter registration deadline was March 30, 2018, and the in-person deadline was April 3, 2018.
Candidates and results
At-Large
General election
General election for Stevens Point Area Public School District School Board At-large (3 seats)
Candidate | % | Votes | ||
| ✔ |  | Margaret Erler (Nonpartisan) | 31.0 | 5,065 |
| ✔ |  | Judy Rannow (Nonpartisan) | 24.9 | 4,068 |
| ✔ |  | Mike Wade (Nonpartisan) | 24.6 | 4,027 |
 | Alex Kochanowski (Nonpartisan) | 19.0 | 3,112 | |
| Other/Write-in votes | 0.5 | 88 | ||
| Total votes: 16,360 | |||
| If you are a candidate and would like to tell readers and voters more about why they should vote for you, complete the Ballotpedia Candidate Connection Survey. | ||||
Additional elections on the ballot
- See also: Wisconsin elections, 2018
Key deadlines
Endorsements
Do you know of an official or organization that endorsed a candidate in this race? Let Ballotpedia know by email at editor@ballotpedia.org.
Past elections
To see results from past elections in the Stevens Point Area School District , click here.
What was at stake?
Report a story for this election
Ballotpedia researches issues in school board elections across the United States, but information availability is a challenge for us in many school districts. Please contact us about the issues that impact your local school district. Note that not all submissions may meet Ballotpedia's coverage requirements for inclusion.
Candidate survey
|
|
Ballotpedia invites school board candidates to participate in its annual survey. |
Election trends

With three incumbents and one challenger running for three seats on the board, the Stevens Point Area school board was guaranteed to keep at least two of the incumbents on the ballot in 2018. The district re-elected all of the incumbents on the ballot once in the previous four election cycles. In 2017, all four incumbents up for election won additional terms after running unopposed. In 2014, 2015, and 2016, however, at least one incumbent on the ballot was defeated by a newcomer.
The table below details election trends for the district, the state, and the country as a whole.
| School board election trends | ||||||
|---|---|---|---|---|---|---|
| Year | Candidates per seat | Uncontested seats | Incumbents running for re-election | Incumbent success rate | Seats won by newcomers | |
| Stevens Point Area School District | ||||||
| 2018 | 1.33 | 0.00% | 100.00% | 100.00% | 0.00% | |
| 2017 | 1.00 | 100.00% | 100.00% | 100.00% | 0.00% | |
| 2016 | 1.50 | 0.00% | 50.00% | 50.00% | 75.00% | |
| 2015 | 1.33 | 0.00% | 66.67% | 50.00% | 66.67% | |
| 2014 | 2.00 | 0.00% | 75.00% | 66.67% | 50.00% | |
| Wisconsin | ||||||
| 2016 | 1.57 | 29.73% | 78.38% | 68.97% | 45.95% | |
| 2015 | 1.38 | 38.24% | 73.53% | 84.00% | 35.29% | |
| 2014 | 1.40 | 46.67% | 86.67% | 88.46% | 23.33% | |
| United States | ||||||
| 2016 | 1.90 | 34.05% | 71.31% | 82.39% | 41.04% | |
| 2015 | 1.72 | 35.95% | 70.37% | 82.66% | 40.81% | |
| 2014 | 1.89 | 32.57% | 75.51% | 81.31% | 38.24% | |
About the district
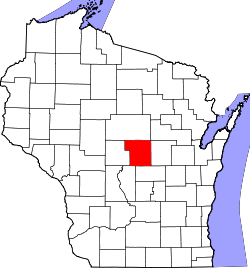
The Stevens Point Area Public School District is located in Portage County in central Wisconsin. The county seat is Stevens Point. Portage County was home to an estimated 70,447 residents in 2016, according to the United States Census Bureau.[8] The district served 7,231 students in the 2015–2016 school year.[9]
Demographics
Higher education achievement
Portage County outperformed Wisconsin as a whole in terms of higher education achievement in the years 2012 to 2016. The United States Census Bureau found that 30.3 percent of Portage County residents aged 25 years or older had attained a bachelor's degree, compared to 28.4 percent of all state residents.[8]
Median household income
From 2012 to 2016, the median household income in Portage County was $52,411. During that same time period, the median household income for the entire state of Wisconsin was $54,610, and it was $55,322 for the entire United States.[8]
Poverty rate
The poverty rate in Portage County between 2012 and 2016 was 11.5 percent, while it was 11.8 percent for the entire state. During that same time period, the poverty rate for the country as a whole was 12.7 percent.[8]
Racial demographics
| Racial Demographics, 2016[8] | |||
|---|---|---|---|
| Race | Portage County (%) | Wisconsin (%) | |
| White | 94.2 | 87.5 | |
| Black or African American | 0.8 | 6.6 | |
| American Indian and Alaska Native | 0.5 | 1.1 | |
| Asian | 3.0 | 2.8 | |
| Native Hawaiian and Other Pacific Islander | 0.0 | 0.1 | |
| Two or more races | 1.4 | 1.9 | |
| Hispanic or Latino | 3.1 | 6.7 | |
Note: Percentages for race and ethnicity may add up to more than 100 percent because respondents may report more than one race and the Hispanic/Latino ethnicity may be selected in conjunction with any race. Read more about race and ethnicity in the census here.
Pivot Counties
- See also: Pivot Counties by state
Twenty-three of 72 Wisconsin counties—32 percent—are Pivot Counties. Pivot Counties are counties that voted for Barack Obama (D) in 2008 and 2012 and for Donald Trump (R) in 2016. Altogether, the nation had 206 Pivot Counties, with most being concentrated in upper midwestern and northeastern states.
| Counties won by Trump in 2016 and Obama in 2012 and 2008 | |||||||
|---|---|---|---|---|---|---|---|
| County | Trump margin of victory in 2016 | Obama margin of victory in 2012 | Obama margin of victory in 2008 | ||||
| Adams County, Wisconsin | 21.92% | 8.73% | 18.35% | ||||
| Buffalo County, Wisconsin | 21.82% | 2.93% | 14.66% | ||||
| Columbia County, Wisconsin | 2.14% | 13.58% | 15.26% | ||||
| Crawford County, Wisconsin | 5.40% | 19.98% | 27.03% | ||||
| Door County, Wisconsin | 3.22% | 6.99% | 17.33% | ||||
| Dunn County, Wisconsin | 11.09% | 4.97% | 14.95% | ||||
| Forest County, Wisconsin | 26.58% | 5.44% | 15.16% | ||||
| Grant County, Wisconsin | 9.43% | 13.77% | 23.88% | ||||
| Jackson County, Wisconsin | 11.74% | 15.01% | 21.84% | ||||
| Juneau County, Wisconsin | 26.05% | 7.03% | 9.00% | ||||
| Kenosha County, Wisconsin | 0.31% | 12.23% | 18.06% | ||||
| Lafayette County, Wisconsin | 8.99% | 15.37% | 22.32% | ||||
| Lincoln County, Wisconsin | 20.60% | 0.71% | 12.48% | ||||
| Marquette County, Wisconsin | 24.09% | 0.27% | 5.28% | ||||
| Pepin County, Wisconsin | 23.08% | 2.22% | 12.89% | ||||
| Price County, Wisconsin | 25.00% | 0.04% | 13.40% | ||||
| Racine County, Wisconsin | 4.28% | 3.54% | 7.41% | ||||
| Richland County, Wisconsin | 5.50% | 16.13% | 20.63% | ||||
| Sauk County, Wisconsin | 0.35% | 18.47% | 23.04% | ||||
| Sawyer County, Wisconsin | 18.41% | 0.49% | 6.23% | ||||
| Trempealeau County, Wisconsin | 12.64% | 14.08% | 26.39% | ||||
| Vernon County, Wisconsin | 4.43% | 14.73% | 22.00% | ||||
| Winnebago County, Wisconsin | 7.34% | 3.73% | 11.66% | ||||
In the 2016 presidential election, Donald Trump (R) won Wisconsin with 47.2 percent of the vote. Hillary Clinton (D) received 46.5 percent. In presidential elections between 1900 and 2016, Wisconsin cast votes for the winning presidential candidate 76.7 percent of the time. In that same time frame, Wisconsin supported Republicans slightly more than Democratic candidates, 50.0 to 46.7 percent. The state, however, favored Democrats in every presidential election from 2000 to 2012 before voting for Trump in 2016.
Presidential results by legislative district
The following table details results of the 2012 and 2016 presidential elections by state Assembly districts in Wisconsin. Click [show] to expand the table. The "Obama," "Romney," "Clinton," and "Trump" columns describe the percent of the vote each presidential candidate received in the district. The "2012 Margin" and "2016 Margin" columns describe the margin of victory between the two presidential candidates in those years. The "Party Control" column notes which party held that seat heading into the 2018 general election. Data on the results of the 2012 and 2016 presidential elections broken down by state legislative districts was compiled by Daily Kos.[10][11]
| In 2012, Barack Obama (D) won 43 out of 99 state Assembly districts in Wisconsin with an average margin of victory of 34.1 points. In 2016, Hillary Clinton (D) won 36 out of 99 state Assembly districts in Wisconsin with an average margin of victory of 34.6 points. Clinton won three districts controlled by Republicans heading into the 2018 elections. |
| In 2012, Mitt Romney (R) won 56 out of 99 state Assembly districts in Wisconsin with an average margin of victory of 12.1 points. In 2016, Donald Trump (R) won 63 out of 99 state Assembly districts in Wisconsin with an average margin of victory of 19.4 points. Trump won two districts controlled by Democrats heading into the 2018 elections. |
| 2016 Presidential Results by State Assembly District ' | |||||||
|---|---|---|---|---|---|---|---|
| District | Obama | Romney | 2012 Margin | Clinton | Trump | 2016 Margin | Party Control |
| 1 | 49.45% | 49.55% | R+0.1 | 40.19% | 55.31% | R+15.1 | R |
| 2 | 45.06% | 53.88% | R+8.8 | 35.98% | 58.55% | R+22.6 | R |
| 3 | 46.37% | 52.37% | R+6 | 39.25% | 54.77% | R+15.5 | R |
| 4 | 47.96% | 51.02% | R+3.1 | 42.82% | 51.96% | R+9.1 | R |
| 5 | 45.84% | 53.01% | R+7.2 | 35.60% | 58.94% | R+23.3 | R |
| 6 | 44.15% | 54.75% | R+10.6 | 30.90% | 64.34% | R+33.4 | R |
| 7 | 57.11% | 41.73% | D+15.4 | 55.20% | 39.20% | D+16 | D |
| 8 | 86.53% | 12.79% | D+73.7 | 82.43% | 14.14% | D+68.3 | D |
| 9 | 74.69% | 24.42% | D+50.3 | 71.60% | 23.86% | D+47.7 | D |
| 10 | 89.76% | 9.63% | D+80.1 | 89.09% | 8.09% | D+81 | D |
| 11 | 86.92% | 12.62% | D+74.3 | 85.40% | 12.20% | D+73.2 | D |
| 12 | 80.00% | 19.52% | D+60.5 | 79.28% | 17.84% | D+61.4 | D |
| 13 | 41.61% | 57.43% | R+15.8 | 46.60% | 48.01% | R+1.4 | R |
| 14 | 42.53% | 56.71% | R+14.2 | 49.36% | 45.05% | D+4.3 | R |
| 15 | 44.86% | 54.03% | R+9.2 | 43.63% | 50.53% | R+6.9 | R |
| 16 | 90.18% | 8.97% | D+81.2 | 88.16% | 8.20% | D+80 | D |
| 17 | 86.03% | 13.52% | D+72.5 | 85.53% | 11.96% | D+73.6 | D |
| 18 | 89.18% | 10.15% | D+79 | 87.03% | 9.71% | D+77.3 | D |
| 19 | 69.95% | 28.13% | D+41.8 | 72.67% | 20.16% | D+52.5 | D |
| 20 | 58.37% | 40.39% | D+18 | 55.33% | 39.27% | D+16.1 | D |
| 21 | 47.93% | 51.07% | R+3.1 | 44.81% | 50.06% | R+5.3 | R |
| 22 | 42.44% | 56.73% | R+14.3 | 35.41% | 60.15% | R+24.7 | R |
| 23 | 34.62% | 64.61% | R+30 | 50.43% | 44.81% | D+5.6 | R |
| 24 | 43.05% | 56.18% | R+13.1 | 45.71% | 49.32% | R+3.6 | R |
| 25 | 46.93% | 51.76% | R+4.8 | 35.85% | 58.74% | R+22.9 | R |
| 26 | 45.64% | 53.35% | R+7.7 | 38.91% | 55.22% | R+16.3 | R |
| 27 | 45.07% | 53.89% | R+8.8 | 40.39% | 54.00% | R+13.6 | R |
| 28 | 43.68% | 54.77% | R+11.1 | 32.63% | 61.90% | R+29.3 | R |
| 29 | 48.16% | 50.05% | R+1.9 | 38.58% | 54.01% | R+15.4 | R |
| 30 | 46.24% | 52.24% | R+6 | 42.51% | 50.44% | R+7.9 | R |
| 31 | 46.56% | 52.48% | R+5.9 | 40.68% | 53.70% | R+13 | R |
| 32 | 41.42% | 57.37% | R+15.9 | 34.97% | 59.41% | R+24.4 | R |
| 33 | 39.95% | 58.97% | R+19 | 35.54% | 59.27% | R+23.7 | R |
| 34 | 44.59% | 54.39% | R+9.8 | 35.28% | 60.34% | R+25.1 | R |
| 35 | 46.89% | 52.10% | R+5.2 | 34.68% | 60.52% | R+25.8 | R |
| 36 | 46.49% | 52.48% | R+6 | 32.07% | 64.35% | R+32.3 | R |
| 37 | 45.97% | 52.93% | R+7 | 39.87% | 54.26% | R+14.4 | R |
| 38 | 41.66% | 57.48% | R+15.8 | 38.23% | 56.78% | R+18.5 | R |
| 39 | 42.12% | 56.85% | R+14.7 | 32.76% | 62.11% | R+29.4 | R |
| 40 | 45.04% | 53.94% | R+8.9 | 32.61% | 62.85% | R+30.2 | R |
| 41 | 48.58% | 50.35% | R+1.8 | 36.02% | 59.60% | R+23.6 | R |
| 42 | 51.09% | 48.03% | D+3.1 | 40.26% | 54.51% | R+14.3 | R |
| 43 | 58.46% | 40.22% | D+18.2 | 50.24% | 43.54% | D+6.7 | D |
| 44 | 63.57% | 35.53% | D+28 | 55.44% | 38.62% | D+16.8 | D |
| 45 | 63.99% | 34.88% | D+29.1 | 52.83% | 41.86% | D+11 | D |
| 46 | 63.63% | 35.46% | D+28.2 | 61.74% | 32.95% | D+28.8 | D |
| 47 | 71.05% | 27.83% | D+43.2 | 71.89% | 23.13% | D+48.8 | D |
| 48 | 77.21% | 21.61% | D+55.6 | 76.06% | 19.26% | D+56.8 | D |
| 49 | 56.34% | 42.26% | D+14.1 | 42.01% | 51.26% | R+9.3 | R |
| 50 | 54.10% | 44.84% | D+9.3 | 38.35% | 57.05% | R+18.7 | R |
| 51 | 59.12% | 39.77% | D+19.4 | 48.42% | 46.59% | D+1.8 | R |
| 52 | 45.04% | 53.91% | R+8.9 | 38.03% | 56.66% | R+18.6 | R |
| 53 | 43.36% | 55.55% | R+12.2 | 34.18% | 60.93% | R+26.7 | R |
| 54 | 57.39% | 41.08% | D+16.3 | 49.16% | 44.12% | D+5 | D |
| 55 | 47.32% | 51.08% | R+3.8 | 41.80% | 51.70% | R+9.9 | R |
| 56 | 43.05% | 55.69% | R+12.6 | 37.98% | 56.68% | R+18.7 | R |
| 57 | 58.41% | 39.31% | D+19.1 | 51.73% | 41.22% | D+10.5 | D |
| 58 | 31.25% | 67.77% | R+36.5 | 28.43% | 66.52% | R+38.1 | R |
| 59 | 31.24% | 67.73% | R+36.5 | 25.52% | 69.73% | R+44.2 | R |
| 60 | 31.82% | 67.23% | R+35.4 | 32.35% | 62.53% | R+30.2 | R |
| 61 | 44.42% | 54.59% | R+10.2 | 36.49% | 58.50% | R+22 | R |
| 62 | 45.73% | 53.46% | R+7.7 | 41.17% | 54.02% | R+12.9 | R |
| 63 | 42.73% | 56.47% | R+13.7 | 37.80% | 57.26% | R+19.5 | R |
| 64 | 58.84% | 40.05% | D+18.8 | 52.63% | 42.23% | D+10.4 | D |
| 65 | 67.06% | 31.78% | D+35.3 | 57.76% | 36.48% | D+21.3 | D |
| 66 | 75.23% | 23.77% | D+51.5 | 68.34% | 26.50% | D+41.8 | D |
| 67 | 48.07% | 50.75% | R+2.7 | 36.41% | 58.15% | R+21.7 | R |
| 68 | 51.24% | 47.56% | D+3.7 | 40.11% | 54.44% | R+14.3 | R |
| 69 | 43.65% | 55.15% | R+11.5 | 34.08% | 60.83% | R+26.8 | R |
| 70 | 48.55% | 50.09% | R+1.5 | 36.82% | 57.83% | R+21 | R |
| 71 | 57.55% | 41.03% | D+16.5 | 50.34% | 43.28% | D+7.1 | D |
| 72 | 48.68% | 50.09% | R+1.4 | 36.95% | 58.55% | R+21.6 | R |
| 73 | 60.93% | 37.66% | D+23.3 | 47.53% | 47.49% | D+0 | D |
| 74 | 57.74% | 40.88% | D+16.9 | 46.22% | 49.38% | R+3.2 | D |
| 75 | 47.55% | 51.22% | R+3.7 | 34.53% | 60.84% | R+26.3 | R |
| 76 | 81.64% | 15.70% | D+65.9 | 82.30% | 11.34% | D+71 | D |
| 77 | 82.23% | 16.20% | D+66 | 83.80% | 11.48% | D+72.3 | D |
| 78 | 71.91% | 26.85% | D+45.1 | 75.62% | 19.47% | D+56.2 | D |
| 79 | 60.89% | 38.29% | D+22.6 | 62.65% | 32.43% | D+30.2 | D |
| 80 | 63.93% | 35.08% | D+28.9 | 62.12% | 32.50% | D+29.6 | D |
| 81 | 61.46% | 37.67% | D+23.8 | 51.23% | 43.11% | D+8.1 | D |
| 82 | 43.03% | 56.32% | R+13.3 | 43.69% | 51.79% | R+8.1 | R |
| 83 | 31.12% | 68.10% | R+37 | 29.71% | 65.91% | R+36.2 | R |
| 84 | 42.31% | 56.84% | R+14.5 | 41.43% | 53.68% | R+12.3 | R |
| 85 | 52.04% | 46.78% | D+5.3 | 44.67% | 49.90% | R+5.2 | R |
| 86 | 43.96% | 55.02% | R+11.1 | 36.19% | 59.18% | R+23 | R |
| 87 | 44.81% | 53.95% | R+9.1 | 30.93% | 64.82% | R+33.9 | R |
| 88 | 48.79% | 50.35% | R+1.6 | 43.75% | 50.75% | R+7 | R |
| 89 | 46.02% | 52.97% | R+6.9 | 32.41% | 63.26% | R+30.9 | R |
| 90 | 63.31% | 35.13% | D+28.2 | 53.29% | 39.82% | D+13.5 | D |
| 91 | 60.63% | 37.68% | D+22.9 | 55.95% | 36.72% | D+19.2 | D |
| 92 | 55.89% | 42.98% | D+12.9 | 40.90% | 54.33% | R+13.4 | R |
| 93 | 47.10% | 51.80% | R+4.7 | 38.30% | 56.18% | R+17.9 | R |
| 94 | 51.53% | 47.32% | D+4.2 | 45.50% | 49.03% | R+3.5 | D |
| 95 | 64.46% | 33.93% | D+30.5 | 58.03% | 34.66% | D+23.4 | D |
| 96 | 55.57% | 42.95% | D+12.6 | 42.90% | 51.64% | R+8.7 | R |
| 97 | 39.90% | 59.02% | R+19.1 | 39.37% | 54.43% | R+15.1 | R |
| 98 | 33.69% | 65.46% | R+31.8 | 35.20% | 59.58% | R+24.4 | R |
| 99 | 26.70% | 72.64% | R+45.9 | 28.97% | 66.40% | R+37.4 | R |
| Total | 52.92% | 45.97% | D+7 | 47.01% | 47.78% | R+0.8 | - |
| Source: Daily Kos | |||||||
See also
| Stevens Point Area School District | Wisconsin | School Boards |
|---|---|---|
 |
||
|
External links
Footnotes
- ↑ Stevens Point Journal, "County executive race, Portage County Board turnover highlight spring election," January 4, 2018
- ↑ Portage County Elections, "Candidate Results Detail," accessed April 3, 2018
- ↑ Stevens Point Area Public School District, "School Board," accessed December 28, 2016
- ↑ 4.0 4.1 Wisconsin Association of School Boards, "Guide for Candidates," accessed November 26, 2017
- ↑ DMV.org, "Voter Registration in Wisconsin," accessed January 22, 2015
- ↑ State statutes stipulate that an individual must have resided in Wisconsin for at least 28 days prior to the election in order to register to vote in that election. However, the United States District Court for the Western District of Wisconsin ruled that "the increase of the durational residency requirement from 10 days to 28 days is unconstitutional." Consequently, the earlier 10-day requirement took effect once again. An appeal of the district court's decision was pending as of September 20, 2016.
- ↑ Wisconsin Statutes, "Section 6.10," accessed November 7, 2016
- ↑ 8.0 8.1 8.2 8.3 8.4 United States Census Bureau, "QuickFacts: Portage County, Wisconsin; Wisconsin; UNITED STATES," accessed March 23, 2018
- ↑ U.S. Department of Education, National Center for Education Statistics, "Common Core of Data, file ccd_lea_052_1414_w_0216161a, 2014-2015," accessed November 16, 2016
- ↑ Daily Kos, "Daily Kos Elections' statewide election results by congressional and legislative districts," July 9, 2013
- ↑ Daily Kos, "Daily Kos Elections' 2016 presidential results for congressional and legislative districts," February 6, 2017
| Stevens Point Area School District elections in 2018 | |
| Portage County, Wisconsin | |
| Election date: | April 3, 2018 |
| Candidates: | At-Large: Incumbent, Meg Erler • Incumbent, Judy Rannow • Incumbent, Mike Wade • Alex Kochanowski |
| Important information: | What was at stake? • Additional elections on the ballot • Key deadlines |

