Minnesota school board elections, 2016
Presidential • U.S. House • State Senate • State House • State judges • Local judges • State ballot measures • School boards • Candidate ballot access |
← 2015 |
2017 →
|
Elections
General elections for Minnesota school boards were held on November 8, 2016. Primary elections, if necessary, were held on August 9, 2016. Special elections could be held in conjunction with primary or general elections to fill vacancies.
Eleven of the 19 Minnesota school districts among America's largest school districts by enrollment held school board elections for 35 seats in 2016. Here are several quick facts about those school board elections:
- The largest school district by enrollment with an election in 2016 was Saint Paul Public Schools with 38,228 K-12 students.
- The smallest Minnesota school district among the nation's largest with an election in 2016 was the Eastern Carver County Public Schools with 9,414 K-12 students.
- Four of Minnesota's largest districts tied for the most seats on the 2016 ballot with four seats up for election each.
- The Saint Paul Public Schools special election had the fewest seats on the 2016 ballot with one seat up for election.
The districts listed below served 189,209 K-12 students during the 2013-2014 school year, according to the National Center for Education Statistics. Click on the district names for more information on each and its school board elections.
| 2016 Minnesota School Board Elections | |||||||
|---|---|---|---|---|---|---|---|
| District | Primary date | General date | Regular term (years) | Seats up for election | Total board seats | Student enrollment | |
| Burnsville-Eagan-Savage School District | NA | 11/8/2016 | 4 | 3 | 7 | 9,605 | |
| Eastern Carver County Public Schools | NA | 11/8/2016 | 4 | 3 | 7 | 9,414 | |
| Elk River Area School District | 8/9/2016 | 11/8/2016 | 4 | 4 | 7 | 13,139 | |
| Lakeville Area Public Schools | NA | 11/8/2016 | 4 | 3 | 6 | 11,067 | |
| Minneapolis Public Schools | NA | 11/8/2016 | 4 | 4 | 9 | 36,817 | |
| North St. Paul-Maplewood-Oakdale School District 622 | NA | 11/8/2016 | 4 | 4 | 7 | 10,742 | |
| Osseo Area Schools | NA | 11/8/2016 | 4 | 3 | 6 | 20,913 | |
| Robbinsdale Area Schools | NA | 11/8/2016 | 4 | 3 | 7 | 12,472 | |
| Rochester Public Schools | 8/9/2016 | 11/8/2016 | 4 | 3 | 7 | 16,761 | |
| Saint Paul Public Schools (special election) |
NA | 11/8/2016 | 1 | 1 | 7 | 38,228 | |
| St. Cloud Area School District | 8/9/2016 | 11/8/2016 | 4 | 4 | 7 | 10,051 | |
August 9 election results
Minnesota school board elections
Three of Minnesota's largest school districts held primary elections on August 9, 2016, to narrow the field of candidates for the general election to two candidates per seat. The candidate who received the least number of votes was defeated in each district's primary. The rest advanced to the general election that was held on November 8, 2016. Three incumbents, one from each district, ran to retain their seats, and all three advanced to the general election.
The Elk River Area School District also held a special election for the open District 2 seat. Three candidates ran to fill the vacancy, and Gregg Peppin was elected to the board.
Election results
Note: An (i) next to a candidate's name indicates incumbent status.
|
Elk River Area School District |
Rochester Public Schools |
Issues
Book banning debate in Anoka-Hennepin

In 2013, officials of the Anoka-Hennepin School District in Minnesota selected the book Eleanor & Park for their "Rock the Book" summer reading program for district high school students. In August 2013, the Parents Action League filed a complaint with the school district regarding the content of the book, which includes profanity and sexually explicit situations, and asked for the district to remove the book from its libraries.[1] School board Chair Tom Heidemann acknowledged that the district had made a mistake in including the book in the summer reading program without consulting parents first, but the decision to ban the book was left to a book review committee.[2]
The American Civil Liberties Union of Minnesota issued a statement asking the school district to keep Eleanor & Park available to students, with its executive director Charles Samuelson arguing, "We are greatly concerned by removing books like this from the school libraries because they deal frankly and honestly with problems that teens face."[3] A book review committee chaired by Anoka High Principal Mike Farley announced on November 22, 2013, that the book would not be removed from district libraries.[4]
Election trends
Trends in Minnesota school board elections

- See also: School boards in session: 2015 in brief
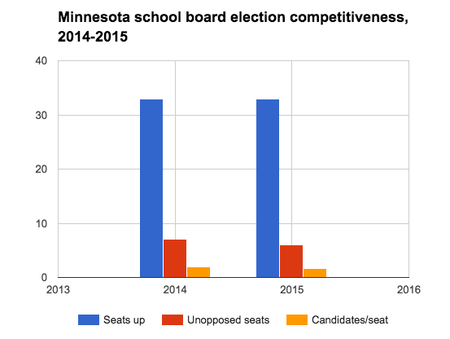
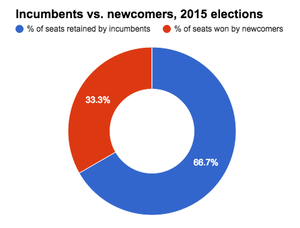
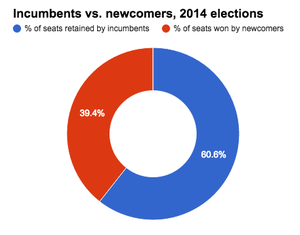
The 2015 school board elections in Minnesota's largest school districts attracted fewer candidates per seat than the state's 2014 school board elections did. Despite having fewer candidates, however, the 2015 elections had a smaller percentage of seats go unopposed than the 2014 elections had. Newcomers fared better in the 2014 elections. They won exactly one-third of the seats that were on the ballot in 2015, compared to 39.39 percent of the seats on the ballot in 2014.
The following sections analyze competitiveness and incumbency advantage in Minnesota's school board elections. These districts did not utilize primary or runoff elections. Winners only had to receive a plurality, or relative majority, of votes to secure a seat. All of the school board elections held in the state in 2014 and 2015 were nonpartisan.
Details of the data discussed here can be found in the table below.
Competitiveness
In 2015, 56 candidates ran for the 33 school board seats up for election in Minnesota's largest school districts, which came to an average of 1.70 candidates per seat. The 2014 elections also had 33 school board seats on the ballot, but a total of 66 candidates sought those seats, which came to an average of two candidates per seat. Six seats—18.18 percent—went unopposed in 2015, compared to the seven seats, or 21.21 percent, that were unopposed in 2014.
Incumbency advantage
|
Nearly all—95.65 percent—of the incumbents who ran for re-election in 2015 retained their seats. Twenty-three of the 33 incumbents whose terms were up for election ran to keep their seats, and 22 of them won. Four of those winning incumbents ran unopposed; the others defeated challengers to win additional terms. In 2014, 86.96 percent of incumbents who ran to retain their seats won re-election. Twenty-three of the 33 incumbents whose terms were on the ballot ran to keep their seats, and 20 of them won. Five of those winners ran unopposed; the other 15 won re-election by defeating challengers. The map below details the success rates for incumbents who ran in the 2015 school board elections that were held in the largest school districts by enrollment in the U.S.
|
  |
Data table
| Minnesota school board elections, 2014 - 2015 | ||||||||||
|---|---|---|---|---|---|---|---|---|---|---|
| 2014 | 2015 | |||||||||
| All candidates | ||||||||||
| Seats up | 33 | 33 | ||||||||
| Candidates | 66 | 56 | ||||||||
| Candidates/seat | 2.00 | 1.70 | ||||||||
| Unopposed seats | 7 | 6 | ||||||||
| % unopposed | 21.21% | 18.18% | ||||||||
| % seats won by newcomers | 39.39% | 33.33% | ||||||||
| Incumbents | ||||||||||
| Sought re-election | 23 | 23 | ||||||||
| Unopposed | 5 | 4 | ||||||||
| Retained | 20 | 22 | ||||||||
| % retained | 86.96% | 95.65% | ||||||||
Academic performance
- See also: Public education in Minnesota
![]() The sections below do not contain the most recently published data on this subject. If you would like to help our coverage grow, consider donating to Ballotpedia.
The sections below do not contain the most recently published data on this subject. If you would like to help our coverage grow, consider donating to Ballotpedia.
| Education terms |
|---|
| For more information on education policy terms, see this article. |
NAEP scores
- See also: NAEP scores by state
The National Center for Education Statistics provides state-by-state data on student achievement levels in mathematics and reading in the National Assessment of Educational Progress (NAEP). The table below presents the percentage of fourth and eighth grade students that scored at or above proficient in reading and math during school year 2012-2013. Compared to three neighboring states (North Dakota, South Dakota, and Wisconsin), Minnesota's fourth and eighth graders earned the highest scores across the board.[5]
| Percent of students scoring at or above proficient, 2012-2013 | ||||
|---|---|---|---|---|
| Math - Grade 4 | Math - Grade 8 | Reading - Grade 4 | Reading - Grade 8 | |
| Minnesota | 59% | 47% | 41% | 41% |
| North Dakota | 48% | 41% | 34% | 34% |
| South Dakota | 40% | 38% | 32% | 36% |
| Wisconsin | 47% | 40% | 35% | 36% |
| United States | 41% | 34% | 34% | 34% |
| Source: United States Department of Education, ED Data Express, "State Tables" | ||||
Graduation, ACT and SAT scores
The following table shows the graduation rates and average composite ACT and SAT scores for Minnesota and surrounding states during the 2012-2013 school year. All statements made in this section refer to that school year.[5][6][7]
In the United States, public schools reported graduation rates that averaged to about 81.4 percent. About 54 percent of all students in the country took the ACT, while 50 percent reported taking the SAT. The average national composite scores for those tests were 20.9 out of a possible 36 for the ACT, and 1498 out of a possible 2400 for the SAT.[8]
Minnesota schools reported a graduation rate of 79.8 percent during the 2012-2013 school year, lowest among its neighboring states.
In Minnesota, more students took the ACT than the SAT in 2013, earning an average ACT score of 23.
| Comparison table for graduation rates and test scores, 2012-2013 | |||||||
|---|---|---|---|---|---|---|---|
| State | Graduation rate, 2013 | Average ACT composite, 2013 | Average SAT composite, 2013 | ||||
| Percent | Quintile ranking** | Score | Participation rate | Score | Participation rate | ||
| Minnesota | 79.8% | Fourth | 23 | 74% | 1780 | 6% | |
| North Dakota | 87.5% | First | 20.5 | 98% | 1799 | 2% | |
| South Dakota | 82.7% | Third | 21.9 | 78% | 1760 | 3% | |
| Wisconsin | 88% | First | 22.1 | 71% | 1771 | 4% | |
| United States | 81.4% | 20.9 | 54% | 1498 | 50% | ||
| **Graduation rates for states in the first quintile ranked in the top 20 percent nationally. Similarly, graduation rates for states in the fifth quintile ranked in the bottom 20 percent nationally. Sources: United States Department of Education, "ED Data Express" ACT.org, "2013 ACT National and State Scores" The Commonwealth Foundation, "SAT scores by state, 2013" | |||||||
Dropout rate
- See also: Public high school dropout rates by state for a full comparison of dropout rates by group in all states
The high school event dropout rate indicates the proportion of students who were enrolled at some time during the school year and were expected to be enrolled in grades nine through 12 in the following school year but were not enrolled by October 1 of the following school year. Students who have graduated, transferred to another school, died, moved to another country, or who are out of school due to illness are not considered dropouts. The average public high school event dropout rate for the United States remained constant at 3.3 percent for both school year 2010–2011 and school year 2011–2012. The event dropout rate for Minnesota was lower than the national average at 1.8 percent in the 2010-2011 school year, and 1.9 percent in the 2011-2012 school year.[9]
State profile
State profile
| Demographic data for Minnesota | ||
|---|---|---|
| Minnesota | U.S. | |
| Total population: | 5,482,435 | 316,515,021 |
| Land area (sq mi): | 79,627 | 3,531,905 |
| Race and ethnicity** | ||
| White: | 84.8% | 73.6% |
| Black/African American: | 5.5% | 12.6% |
| Asian: | 4.4% | 5.1% |
| Native American: | 1% | 0.8% |
| Pacific Islander: | 0% | 0.2% |
| Two or more: | 2.7% | 3% |
| Hispanic/Latino: | 5% | 17.1% |
| Education | ||
| High school graduation rate: | 92.4% | 86.7% |
| College graduation rate: | 33.7% | 29.8% |
| Income | ||
| Median household income: | $61,492 | $53,889 |
| Persons below poverty level: | 12.2% | 11.3% |
| Source: U.S. Census Bureau, "American Community Survey" (5-year estimates 2010-2015) Click here for more information on the 2020 census and here for more on its impact on the redistricting process in Minnesota. **Note: Percentages for race and ethnicity may add up to more than 100 percent because respondents may report more than one race and the Hispanic/Latino ethnicity may be selected in conjunction with any race. Read more about race and ethnicity in the census here. | ||
Presidential voting pattern
- See also: Presidential voting trends in Minnesota
Minnesota voted for the Democratic candidate in all seven presidential elections between 2000 and 2024.
Pivot Counties (2016)
Ballotpedia identified 206 counties that voted for Donald Trump (R) in 2016 after voting for Barack Obama (D) in 2008 and 2012. Collectively, Trump won these Pivot Counties by more than 580,000 votes. Of these 206 counties, 19 are located in Minnesota, accounting for 9.22 percent of the total pivot counties.[10]
Pivot Counties (2020)
In 2020, Ballotpedia re-examined the 206 Pivot Counties to view their voting patterns following that year's presidential election. Ballotpedia defined those won by Trump won as Retained Pivot Counties and those won by Joe Biden (D) as Boomerang Pivot Counties. Nationwide, there were 181 Retained Pivot Counties and 25 Boomerang Pivot Counties. Minnesota had 15 Retained Pivot Counties and four Boomerang Pivot Counties, accounting for 8.29 and 16.00 percent of all Retained and Boomerang Pivot Counties, respectively.
More Minnesota coverage on Ballotpedia
- Elections in Minnesota
- United States congressional delegations from Minnesota
- Public policy in Minnesota
- Endorsers in Minnesota
- Minnesota fact checks
- More...
See also
| Minnesota | School Boards | News and Analysis |
|---|---|---|
 |
 | |
Footnotes
- ↑ CityPages, "Parents Action League wants 'Eleanor & Park' removed from Anoka-Hennepin libraries," October 2, 2013
- ↑ Minnesota Public Radio, "Using 'R rated' book without asking parents was wrong, school chair says," September 25, 2013
- ↑ American Civil Liberties Union of Minnesota, "ACLU urges Anoka-Hennepin School District to keep Eleanor & Park on the shelves," September 26, 2013
- ↑ Star Tribune, "Challenged book to stay on Anoka High library shelves," November 22, 2013
- ↑ 5.0 5.1 United States Department of Education, ED Data Express, "State Tables," accessed May 13, 2014
- ↑ ACT, "2012 ACT National and State Scores," accessed May 13, 2014
- ↑ Commonwealth Foundation, "SAT Scores by State 2013," October 10, 2013
- ↑ StudyPoints, "What's a good SAT score or ACT score?" accessed June 7, 2015
- ↑ United States Department of Education, National Center for Education Statistics, "Common Core of Data (CCD), State Dropout and Graduation Rate Data File, School Year 2010-11, Provision Version 1a and School Year 2011-12, Preliminary Version 1a," accessed May 13, 2014
- ↑ The raw data for this study was provided by Dave Leip of Atlas of U.S. Presidential Elections.
| |||||