Become part of the movement for unbiased, accessible election information. Donate today.
Greater Clark County Schools, Indiana
Ballotpedia provides comprehensive election coverage of the 100 largest cities in America by population as well as mayoral, city council, and district attorney election coverage in state capitals outside of the 100 largest cities. This school district is outside of that coverage scope and does not receive scheduled updates.
| Greater Clark County Schools |
|---|
| Clark County, Indiana |
| District details |
| Superintendent: Andrew Melin |
| # of school board members: 7 members |
| Website: Link |
Greater Clark County Schools is a school district in Indiana. The district was the 20th-largest school district in the state in the 2013–2014 school year and served 10,553 students.[1]
About the district
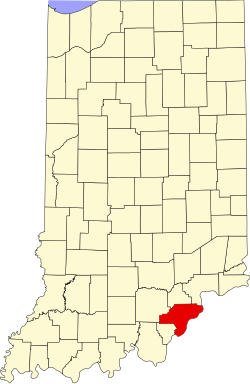
Greater Clark County Schools is located in Clark County, Ind. The county seat is Jeffersonville. Clark County was home to 115,371 residents between 2010 and 2015, according to the United States Census Bureau.[2]
Demographics
Clark County underperformed compared to Indiana as a whole in terms of higher education attainment from 2010 to 2014. The United States Census Bureau found that 19.7 percent of county residents age 25 and older had attained a bachelor's degree or higher, compared to 23.6 percent for state residents. The median household income for the county was $51,182, compared to $48,737 for the state. County residents lived below the poverty level at a rate of 10.6 percent, while that rate was 14.5 percent for state residents.[2]
|
| |||||||||||||||||||||||||||||||||||||||||||
Note: Percentages for race and ethnicity may add up to more than 100 percent because respondents may report more than one race and the Hispanic/Latino ethnicity may be selected in conjunction with any race. Read more about race and ethnicity in the census here.
Superintendent
| |
This information is updated as we become aware of changes. Please contact us with any updates. |
The superintendent of Greater Clark County Schools is Dr. Andrew Melin.[4]
School board elections
Greater Clark County schools are overseen by a seven-member board elected by district to four-year terms. School board members are paid $2,000 annually for their services as well as a per diem amount which is determined by a board resolution at the annual organizational meeting.[5]
| Greater Clark County School Corporation Board of School Trustees | |||
|---|---|---|---|
| Member | District | Term ends | |
| Teresa Zollman | District 1 | 2018 | |
| Katie Hutchinson | District 2 | 2020 | |
| Mark Pavey | District 3 | 2018 | |
| Nancy Kraft | District 4 | 2018 | |
| Christina Gilkey | District 5 | 2020 | |
| Milton Clayton | District 6 | 2020 | |
| Teresa Bottorff-Perkins | District 7 | 2020 | |
| |
This officeholder information was last updated on April 9, 2018. Please contact us with any updates. | |
Election dates
Members of the Greater Clark County School Corporation Board of School Trustees are elected to four-year terms. Each election is held on a staggered basis in November during even-numbered years. Three seats were up for election in 2014 and four seats were up for election in 2016.
Public participation in board meetings
The Greater Clark County School Corporation Board of School Trustees maintains the following policy on public testimony during board meetings:
| “ | The School Board recognizes the value of public comment on educational issues and the importance of allowing members of the public to express themselves on Corporation matters.
To permit fair and orderly public expression, the Board may provide a period for public participation at every regular meeting of the Board and at those public meetings of the Board during which action may be taken and publish procedures to govern such participation in Board meetings. [6] |
” |
| —Greater Clark County Schools[7] | ||
Budget
From 1993 to 2013, the Greater Clark County school district had an average of $96,000,286 in revenue and $94,889,857 in expenditures, according to the United States Census Bureau's survey of school system finances. The district had a yearly average of $39,125,524 in outstanding debt. The district retired $1,883,000 of its debt and issued $5,536,714 in new debt each year on average.[8]
Revenue
The table below separates the district's revenue into the three sources identified by the agency: local, state, and federal.
| Revenue by Source | |||||||||||
|---|---|---|---|---|---|---|---|---|---|---|---|
| Fiscal Year |
Local | State | Federal | Revenue Total | |||||||
| Total | % of Revenue | Total | % of Revenue | Total | % of Revenue | ||||||
| Click [show] on the right to display the revenue data for prior years. | |||||||||||
|---|---|---|---|---|---|---|---|---|---|---|---|
| 1993 | $23,027,000 | 37.10% | $35,182,000 | 56.68% | $3,866,000 | 6.23% | $62,075,000 | ||||
| 1994 | $27,936,000 | 42.17% | $34,945,000 | 52.76% | $3,359,000 | 5.07% | $66,240,000 | ||||
| 1995 | $26,180,000 | 37.22% | $40,368,000 | 57.39% | $3,797,000 | 5.40% | $70,345,000 | ||||
| 1996 | $21,433,000 | 33.64% | $38,315,000 | 60.14% | $3,966,000 | 6.22% | $63,714,000 | ||||
| 1997 | $37,261,000 | 43.69% | $44,258,000 | 51.89% | $3,766,000 | 4.42% | $85,285,000 | ||||
| 1998 | $34,216,000 | 42.37% | $42,654,000 | 52.82% | $3,878,000 | 4.80% | $80,748,000 | ||||
| 1999 | $28,127,000 | 35.08% | $46,389,000 | 57.85% | $5,671,000 | 7.07% | $80,187,000 | ||||
| 2000 | $30,802,000 | 36.79% | $47,635,000 | 56.90% | $5,278,000 | 6.30% | $83,715,000 | ||||
| 2001 | $30,701,000 | 35.54% | $50,069,000 | 57.96% | $5,619,000 | 6.50% | $86,389,000 | ||||
| 2002 | $35,153,000 | 39.64% | $47,238,000 | 53.27% | $6,289,000 | 7.09% | $88,680,000 | ||||
| 2003 | $20,454,000 | 26.55% | $49,637,000 | 64.42% | $6,960,000 | 9.03% | $77,051,000 | ||||
| 2004 | $20,630,000 | 25.38% | $52,486,000 | 64.58% | $8,153,000 | 10.03% | $81,269,000 | ||||
| 2005 | $49,240,000 | 41.95% | $59,049,000 | 50.31% | $9,082,000 | 7.74% | $117,371,000 | ||||
| 2006 | $42,604,000 | 37.92% | $59,793,000 | 53.22% | $9,961,000 | 8.87% | $112,358,000 | ||||
| 2007 | $32,859,000 | 32.34% | $58,756,000 | 57.82% | $9,997,000 | 9.84% | $101,612,000 | ||||
| 2008 | $42,061,000 | 38.02% | $58,239,000 | 52.64% | $10,330,000 | 9.34% | $110,630,000 | ||||
| 2009 | $58,469,000 | 42.07% | $62,749,000 | 45.15% | $17,751,000 | 12.77% | $138,969,000 | ||||
| 2010 | $43,492,000 | 31.83% | $76,719,000 | 56.16% | $16,407,000 | 12.01% | $136,618,000 |
| 2011 | $30,842,000 | 24.11% | $77,527,000 | 60.61% | $19,535,000 | 15.27% | $127,904,000 |
| 2012 | $29,572,000 | 24.60% | $79,300,000 | 65.97% | $11,342,000 | 9.43% | $120,214,000 |
| 2013 | $31,537,000 | 25.30% | $79,762,000 | 64.00% | $13,333,000 | 10.70% | $124,632,000 |
| Avg. | $33,171,238 | 34.92% | $54,336,667 | 56.79% | $8,492,381 | 8.29% | $96,000,286 |
Expenditures
The table below separates the district's expenditures into five categories identified by the agency:
- Instruction: operation expenditures, state payments on behalf of the district for instruction and benefits, and retirement system transfers
- Support Services: support services, food services, and retirement system transfers for support service staff
- Capital Spending: capital outlay expenditures (i.e., construction, land or facilities purchases, and equipment purchases)
- Debt & Gov. Payments: payments to state and local governments and interest on school system debt
- Other: all other non-K-12 programs, except food services
| Expenditures by Category | |||||||||||
|---|---|---|---|---|---|---|---|---|---|---|---|
| Fiscal Year |
Instruction | Support Services | Capital Spending | Debt & Gov. Payments | Other | Budget Total | |||||
| Total | % of Budget | Total | % of Budget | Total | % of Budget | Total | % of Budget | Total | % of Budget | ||
| Click [show] on the right to display the expenditure data for prior years. | |||||||||||
|---|---|---|---|---|---|---|---|---|---|---|---|
| 1993 | $31,145,000 | 53.42% | $19,080,000 | 32.73% | $2,079,000 | 3.57% | $2,933,000 | 5.03% | $3,062,000 | 5.25% | $58,299,000 |
| 1994 | $33,933,000 | 52.44% | $19,914,000 | 30.77% | $2,984,000 | 4.61% | $3,713,000 | 5.74% | $4,168,000 | 6.44% | $64,712,000 |
| 1995 | $34,799,000 | 52.66% | $18,951,000 | 28.68% | $4,444,000 | 6.73% | $4,332,000 | 6.56% | $3,553,000 | 5.38% | $66,079,000 |
| 1996 | $36,713,000 | 54.62% | $19,229,000 | 28.61% | $3,788,000 | 5.64% | $3,810,000 | 5.67% | $3,677,000 | 5.47% | $67,217,000 |
| 1997 | $40,699,000 | 53.76% | $21,296,000 | 28.13% | $3,958,000 | 5.23% | $4,184,000 | 5.53% | $5,574,000 | 7.36% | $75,711,000 |
| 1998 | $42,126,000 | 56.38% | $21,670,000 | 29.00% | $4,619,000 | 6.18% | $4,158,000 | 5.57% | $2,143,000 | 2.87% | $74,716,000 |
| 1999 | $44,439,000 | 56.85% | $22,224,000 | 28.43% | $5,867,000 | 7.51% | $4,129,000 | 5.28% | $1,510,000 | 1.93% | $78,169,000 |
| 2000 | $46,497,000 | 57.44% | $24,408,000 | 30.15% | $5,877,000 | 7.26% | $2,929,000 | 3.62% | $1,233,000 | 1.52% | $80,944,000 |
| 2001 | $48,247,000 | 57.58% | $25,772,000 | 30.76% | $5,037,000 | 6.01% | $3,345,000 | 3.99% | $1,391,000 | 1.66% | $83,792,000 |
| 2002 | $54,077,000 | 58.31% | $27,059,000 | 29.18% | $6,391,000 | 6.89% | $3,894,000 | 4.20% | $1,320,000 | 1.42% | $92,741,000 |
| 2003 | $55,968,000 | 57.44% | $28,517,000 | 29.27% | $7,415,000 | 7.61% | $3,855,000 | 3.96% | $1,680,000 | 1.72% | $97,435,000 |
| 2004 | $57,494,000 | 58.97% | $29,993,000 | 30.76% | $6,152,000 | 6.31% | $3,537,000 | 3.63% | $327,000 | 0.34% | $97,503,000 |
| 2005 | $72,355,000 | 60.02% | $37,255,000 | 30.90% | $5,547,000 | 4.60% | $4,121,000 | 3.42% | $1,281,000 | 1.06% | $120,559,000 |
| 2006 | $65,654,000 | 58.81% | $35,557,000 | 31.85% | $4,953,000 | 4.44% | $3,874,000 | 3.47% | $1,592,000 | 1.43% | $111,630,000 |
| 2007 | $67,826,000 | 58.99% | $34,829,000 | 30.29% | $5,262,000 | 4.58% | $5,538,000 | 4.82% | $1,524,000 | 1.33% | $114,979,000 |
| 2008 | $65,408,000 | 56.93% | $34,246,000 | 29.81% | $4,388,000 | 3.82% | $8,325,000 | 7.25% | $2,530,000 | 2.20% | $114,897,000 |
| 2009 | $66,030,000 | 57.35% | $36,959,000 | 32.10% | $4,924,000 | 4.28% | $3,586,000 | 3.11% | $3,628,000 | 3.15% | $115,127,000 |
| 2010 | $64,599,000 | 55.01% | $36,028,000 | 30.68% | $8,055,000 | 6.86% | $5,638,000 | 4.80% | $3,106,000 | 2.65% | $117,426,000 |
| 2011 | $65,783,000 | 52.03% | $41,452,000 | 32.78% | $11,361,000 | 8.99% | $5,276,000 | 4.17% | $2,570,000 | 2.03% | $126,442,000 |
| 2012 | $68,303,000 | 56.70% | $37,371,000 | 31.02% | $7,459,000 | 6.19% | $5,064,000 | 4.20% | $2,258,000 | 1.87% | $120,455,000 |
| 2013 | $63,183,000 | 55.49% | $36,633,000 | 32.18% | $6,570,000 | 5.77% | $5,038,000 | 4.42% | $2,430,000 | 2.13% | $113,854,000 |
| Avg. | $53,584,667 | 56.25% | $28,973,476 | 30.39% | $5,577,619 | 5.86% | $4,346,619 | 4.69% | $2,407,476 | 2.82% | $94,889,857 |
Debt
The table below shows the amount of debt retired, issued, and outstanding in the district for each year.
| Debt | |||
|---|---|---|---|
| Fiscal Year |
Retired | Issued | Outstanding |
| Click [show] on the right to display the debt data for prior years. | |||
|---|---|---|---|
| 1993 | $151,000 | $0 | $2,988,000 |
| 1994 | $80,000 | $0 | $109,000 |
| 1995 | $80,000 | $1,000,000 | $1,029,000 |
| 1996 | $62,000 | $6,000 | $973,000 |
| 1997 | $62,000 | $0 | $912,000 |
| 1998 | $62,000 | $724,000 | $1,574,000 |
| 1999 | $195,000 | $1,692,000 | $3,072,000 |
| 2000 | $274,000 | $0 | $2,798,000 |
| 2001 | $293,000 | $0 | $2,504,000 |
| 2002 | $293,000 | $0 | $2,211,000 |
| 2003 | $269,000 | $0 | $6,442,000 |
| 2004 | $661,000 | $2,500,000 | $20,082,000 |
| 2005 | $1,232,000 | $716,000 | $3,265,000 |
| 2006 | $743,000 | $0 | $22,921,000 |
| 2007 | $892,000 | $0 | $27,629,000 |
| 2008 | $4,489,000 | $56,635,000 | $111,306,000 |
| 2009 | $3,598,000 | $41,955,000 | $137,308,000 |
| 2010 | $5,998,000 | $220,000 | $123,711,000 |
| 2011 | $6,369,000 | $2,928,000 | $113,959,000 |
| 2012 | $6,616,000 | $7,895,000 | $120,738,000 |
| 2013 | $7,124,000 | $0 | $116,105,000 |
| Avg. | $1,883,000 | $5,536,714 | $39,125,524 |
Teacher salaries
The teacher salary schedule in Greater Clark County Schools is based on coursework completed beyond a bachelor's degree. A teacher can earn a higher salary by pursuing graduate work and a master's degree. The table below shows the salary schedule for teachers in the district for the 2015-2016 school year. The numbers listed in addition to each degree indicate the number of graduate credits required to enter that salary range.[9]
| Greater Clark County Schools 2015-2016 Salary Structure | |||||
|---|---|---|---|---|---|
| Degree level | Minimum salary ($) | Maximum salary ($) | |||
| B.A. | 34,637 | 41,236 | |||
| B.A.+ 16 | 36,495 | 44,620 | |||
| B.A.+ 32 | 38,357 | 51,401 | |||
| M.A. | 40,221 | 53,269 | |||
| M.A.+ 16 | 42,087 | 55,123 | |||
| M.A.+ 32 | 44,447 | 67,689 | |||
| Ph.D. | 45,947 | 69,189 | |||
| ASC | 47,589 | 70,831 | |||
| ASC + Ph.D. | 49,089 | 72,331 | |||
Contact information

Greater Clark County Schools
2112 Utica-Sellersburg Road
Jeffersonville, IN 47130
Phone: (812) 283-0701
See also
| Indiana | School Board Elections | News and Analysis |
|---|---|---|
 |
 | |
|
Greater Clark County Schools: |
External links
- Greater Clark County Schools
- Clark County Indiana Community Portal
- Indiana Department of Education
- Indiana School Boards Association
Footnotes
- ↑ National Center for Education Statistics, "ELSI Table Generator," accessed November 16, 2015
- ↑ 2.0 2.1 2.2 United States Census Bureau, "Clark County, Indiana," accessed September 26, 2016
- ↑ Indiana Election Division, "Election Results," accessed September 3, 2014
- ↑ Greater Clark County Schools, "Superintendent," accessed March 2, 2016
- ↑ Greater Clark County Schools, "Policies & Bylaws," accessed March 2, 2016
- ↑ Note: This text is quoted verbatim from the original source. Any inconsistencies are attributable to the original source.
- ↑ Greater Clark County Schools, "Bylaws & Policies," accessed March 2, 2016
- ↑ United States Census Bureau, "Public School System Finances: Historical Data," accessed December 1, 2015
- ↑ Greater Clark County Schools, "Clark County School District Licensed Salary Schedule," accessed March 23, 2016
| |||||
 |
State of Indiana Indianapolis (capital) |
|---|---|
| Elections |
What's on my ballot? | Elections in 2025 | How to vote | How to run for office | Ballot measures |
| Government |
Who represents me? | U.S. President | U.S. Congress | Federal courts | State executives | State legislature | State and local courts | Counties | Cities | School districts | Public policy |
|
This school board-related article is a sprout; we plan on making it grow in the future. If you would like to help it grow, please consider donating to Ballotpedia. |