Clovis Unified School District, California
| Clovis Unified School District |
|---|
| Fresno County, California |
| District details |
| Superintendent: Eimear O'Farrell |
| # of school board members: 7 |
| Website: Link |
Clovis Unified School District is a school district in California that served 40,783 students during the 2013-2014 school year.[1] This district was the 18th-largest by enrollment in the state of California.
About the district
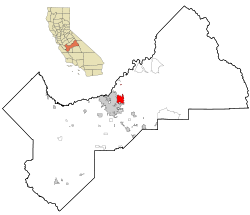
The Clovis Unified School District is located in Fresno County in central California. The county seat is Fresno. Fresno County was home to 974,861 residents in 2015, according to the United States Census Bureau.[2]
Demographics
Fresno County underperformed compared to California as a whole in terms of higher education achievement from 2010 to 2014. The United States Census Bureau found that 19.5 percent of county residents aged 25 years and older had attained a bachelor's degree, compared to 31 percent of state residents. The median household income for Fresno County was $45,201, compared to $61,489 for the entire state. The percentage of people in poverty was 27.5 percent, while it was 16.4 percent statewide.[2]
|
| ||||||||||||||||||||||||||||||||||||||||||||||
Note: Percentages for race and ethnicity may add up to more than 100 percent because respondents may report more than one race and the Hispanic/Latino ethnicity may be selected in conjunction with any race. Read more about race and ethnicity in the census here.
Superintendent
| |
This information is updated as we become aware of changes. Please contact us with any updates. |
Eimear O'Farrell is the superintendent of the Clovis Unified School District. O'Farrell was appointed superintendent on May 30, 2017. O'Farrell's previous career experience includes working as an elementary school teacher, learning director, and principal.[4][5]
Past superintendents
- Janet Young was the superintendent of the Clovis Unified School District from 2014 to 2017. Young's previous career experience included working as a teacher, principal, and director of school and community relations.[6][7]
School board elections
The Clovis Unified School District Board of Education consists of seven members elected to four-year terms by specific geographic districts.
| Clovis Unified Board of Education | |||
|---|---|---|---|
| Member | Trustee Area | Assumed office | Term Ends |
| Susan Hatmaker | 1 | 2018 | 2022 |
| Ginny Hovsepian | 2 | 1991 | 2020 |
| Tiffany Stoker Madsen | 3 | 2018 | 2022 |
| Hugh Awtrey | 4 | 2019 | 2020 |
| Steven Fogg | 5 | 2016 | 2020 |
| Betsy Sandoval | 6 | 1996 | 2022 |
| Chris Casado | 7 | 2008 | 2020 |
| |
This officeholder information was last updated on February 12, 2020. Please contact us with any updates. | |
Election dates
Members of the Clovis Unified Board of Education are elected to four-year terms on a staggered basis every even-numbered year.[8]
A general election was scheduled for November 3, 2020.
Public participation in board meetings
The Clovis Unified Board of Education maintains the following policy on public testimony during board meetings:
| “ | All meetings of the Board shall be open to the public. All actions of the Board shall be taken openly. The public is invited to attend Board meetings and will be given opportunity to voice opinions. However, the law requires the Board to respect employees’ privacy. Members of the public may feel free to use this time to criticize either the Board or the District as a whole, but if there is a complaint about an individual employee which could result in disciplinary action, the District’s complaint procedure should be followed; or the individual must wait until the Board can schedule a closed session as required by the open meeting laws, including advance notice to the employee. The Board, as the representative body of the District, wishes to provide an avenue for any citizen
to express interest in, and concern for, the District. Accordingly, the Board hereby adopts the
following rules concerning public participation at meetings of the Board:
2. In addition, members of the public also have the right to comment upon all matters included on the formal agenda whether placed there by members of the public or otherwise. In connection therewith, the President of the Board reserves the right to:
3. Finally, the Board shall take testimony on matters not included on the agenda of a regularly scheduled meeting which members of the public wish to bring to the attention of the Board. This discussion shall occur during the “Public Presentation” portion of the agenda and must be delivered by an individual physically present at the meeting. Individuals wishing to make a presentation must so advise the Board President by completing a “sign-in” sheet prior to the meeting. Individual presentations shall be limited to a maximum of three (3) minutes. Each individual wishing to address the Board is allocated 3 minutes and may NOT give their 3 minutes to another individual. The Board will take no action on such matters at the same meeting at which such testimony is taken. Nothing herein shall limit further discussion on such subject matter at a subsequent meeting of the Board.[9] |
” |
| —Clovis Unified Board of Education (2014)[10] | ||
Budget
From 1993 to 2013, the Clovis Unified School District had an average of $296,412,429 in revenue and $297,667,619 in expenditures, according to the United States Census Bureau's survey of school system finances. The district had a yearly average of $222,301,429 in outstanding debt. The district retired $28,673,810 of its debt and issued $39,491,095 in new debt each year on average.[11]
Revenue
The table below separates the district's revenue into the three sources identified by the agency: local, state, and federal.
| Revenue by Source | |||||||||||
|---|---|---|---|---|---|---|---|---|---|---|---|
| Fiscal Year |
Local | State | Federal | Revenue Total | |||||||
| Total | % of Revenue | Total | % of Revenue | Total | % of Revenue | ||||||
| Click [show] on the right to display the revenue data for prior years. | |||||||||||
|---|---|---|---|---|---|---|---|---|---|---|---|
| 1993 | $33,649,000 | 20.12% | $83,902,000 | 50.16% | $49,723,000 | 29.73% | $167,274,000 | ||||
| 1994 | $39,806,000 | 25.77% | $82,897,000 | 53.66% | $31,778,000 | 20.57% | $154,481,000 | ||||
| 1995 | $56,661,000 | 37.37% | $84,533,000 | 55.75% | $10,432,000 | 6.88% | $151,626,000 | ||||
| 1996 | $60,399,000 | 36.00% | $96,461,000 | 57.49% | $10,916,000 | 6.51% | $167,776,000 | ||||
| 1997 | $69,049,000 | 35.58% | $117,781,000 | 60.69% | $7,227,000 | 3.72% | $194,057,000 | ||||
| 1998 | $79,938,000 | 34.96% | $140,738,000 | 61.56% | $7,959,000 | 3.48% | $228,635,000 | ||||
| 1999 | $73,482,000 | 32.09% | $146,302,000 | 63.89% | $9,208,000 | 4.02% | $228,992,000 | ||||
| 2000 | $82,764,000 | 32.23% | $164,581,000 | 64.10% | $9,415,000 | 3.67% | $256,760,000 | ||||
| 2001 | $84,903,000 | 30.74% | $180,980,000 | 65.52% | $10,338,000 | 3.74% | $276,221,000 | ||||
| 2002 | $94,530,000 | 34.63% | $166,460,000 | 60.98% | $11,963,000 | 4.38% | $272,953,000 | ||||
| 2003 | $110,840,000 | 36.65% | $176,430,000 | 58.34% | $15,166,000 | 5.01% | $302,436,000 | ||||
| 2004 | $112,689,000 | 37.32% | $172,776,000 | 57.22% | $16,463,000 | 5.45% | $301,928,000 | ||||
| 2005 | $119,153,000 | 36.56% | $189,429,000 | 58.12% | $17,327,000 | 5.32% | $325,909,000 | ||||
| 2006 | $132,028,000 | 31.84% | $264,701,000 | 63.83% | $17,962,000 | 4.33% | $414,691,000 | ||||
| 2007 | $136,677,000 | 32.70% | $262,585,000 | 62.83% | $18,676,000 | 4.47% | $417,938,000 | ||||
| 2008 | $150,076,000 | 35.33% | $255,209,000 | 60.09% | $19,446,000 | 4.58% | $424,731,000 | ||||
| 2009 | $137,193,000 | 33.65% | $240,154,000 | 58.90% | $30,415,000 | 7.46% | $407,762,000 | ||||
| 2010 | $125,984,000 | 33.65% | $216,921,000 | 57.95% | $31,437,000 | 8.40% | $374,342,000 |
| 2011 | $123,810,000 | 31.46% | $234,714,000 | 59.63% | $35,062,000 | 8.91% | $393,586,000 |
| 2012 | $114,674,000 | 30.91% | $227,731,000 | 61.38% | $28,626,000 | 7.72% | $371,031,000 |
| 2013 | $120,702,000 | 30.83% | $244,982,000 | 62.57% | $25,848,000 | 6.60% | $391,532,000 |
| Avg. | $98,047,952 | 32.88% | $178,584,143 | 59.75% | $19,780,333 | 7.38% | $296,412,429 |
Expenditures
The table below separates the district's expenditures into five categories identified by the agency:
- Instruction: operation expenditures, state payments on behalf of the district for instruction and benefits, and retirement system transfers
- Support Services: support services, food services, and retirement system transfers for support service staff
- Capital Spending: capital outlay expenditures (i.e., construction, land or facilities purchases, and equipment purchases)
- Debt & Gov. Payments: payments to state and local governments and interest on school system debt
- Other: all other non-K-12 programs, except food services
| Expenditures by Category | |||||||||||
|---|---|---|---|---|---|---|---|---|---|---|---|
| Fiscal Year |
Instruction | Support Services | Capital Spending | Debt & Gov. Payments | Other | Budget Total | |||||
| Total | % of Budget | Total | % of Budget | Total | % of Budget | Total | % of Budget | Total | % of Budget | ||
| Click [show] on the right to display the expenditure data for prior years. | |||||||||||
|---|---|---|---|---|---|---|---|---|---|---|---|
| 1993 | $81,945,000 | 41.26% | $53,746,000 | 27.06% | $42,562,000 | 21.43% | $4,527,000 | 2.28% | $15,818,000 | 7.96% | $198,598,000 |
| 1994 | $68,136,000 | 39.81% | $46,678,000 | 27.28% | $47,146,000 | 27.55% | $4,205,000 | 2.46% | $4,971,000 | 2.90% | $171,136,000 |
| 1995 | $71,849,000 | 42.53% | $47,169,000 | 27.92% | $27,830,000 | 16.47% | $5,625,000 | 3.33% | $16,471,000 | 9.75% | $168,944,000 |
| 1996 | $79,664,000 | 46.55% | $51,439,000 | 30.06% | $32,228,000 | 18.83% | $2,538,000 | 1.48% | $5,252,000 | 3.07% | $171,121,000 |
| 1997 | $88,999,000 | 49.13% | $52,643,000 | 29.06% | $29,393,000 | 16.23% | $4,970,000 | 2.74% | $5,129,000 | 2.83% | $181,134,000 |
| 1998 | $95,276,000 | 41.75% | $62,089,000 | 27.21% | $57,699,000 | 25.29% | $8,975,000 | 3.93% | $4,149,000 | 1.82% | $228,188,000 |
| 1999 | $99,118,000 | 40.56% | $66,384,000 | 27.16% | $69,997,000 | 28.64% | $4,153,000 | 1.70% | $4,739,000 | 1.94% | $244,391,000 |
| 2000 | $106,981,000 | 38.71% | $76,706,000 | 27.76% | $78,723,000 | 28.48% | $6,033,000 | 2.18% | $7,924,000 | 2.87% | $276,367,000 |
| 2001 | $126,077,000 | 46.14% | $91,671,000 | 33.55% | $43,785,000 | 16.02% | $6,478,000 | 2.37% | $5,228,000 | 1.91% | $273,239,000 |
| 2002 | $137,301,000 | 48.81% | $97,166,000 | 34.54% | $34,644,000 | 12.32% | $6,540,000 | 2.33% | $5,625,000 | 2.00% | $281,276,000 |
| 2003 | $142,770,000 | 48.78% | $100,008,000 | 34.17% | $36,859,000 | 12.59% | $7,571,000 | 2.59% | $5,444,000 | 1.86% | $292,652,000 |
| 2004 | $141,465,000 | 49.49% | $96,841,000 | 33.88% | $34,546,000 | 12.09% | $7,588,000 | 2.65% | $5,417,000 | 1.90% | $285,857,000 |
| 2005 | $154,019,000 | 49.27% | $105,172,000 | 33.64% | $39,644,000 | 12.68% | $7,689,000 | 2.46% | $6,078,000 | 1.94% | $312,602,000 |
| 2006 | $166,457,000 | 40.71% | $113,055,000 | 27.65% | $106,396,000 | 26.02% | $9,853,000 | 2.41% | $13,079,000 | 3.20% | $408,840,000 |
| 2007 | $189,057,000 | 41.46% | $124,987,000 | 27.41% | $116,328,000 | 25.51% | $10,587,000 | 2.32% | $15,085,000 | 3.31% | $456,044,000 |
| 2008 | $193,524,000 | 45.15% | $131,872,000 | 30.77% | $77,971,000 | 18.19% | $10,988,000 | 2.56% | $14,261,000 | 3.33% | $428,616,000 |
| 2009 | $190,185,000 | 48.31% | $128,108,000 | 32.54% | $46,837,000 | 11.90% | $21,221,000 | 5.39% | $7,332,000 | 1.86% | $393,683,000 |
| 2010 | $189,753,000 | 52.67% | $122,993,000 | 34.14% | $28,832,000 | 8.00% | $12,205,000 | 3.39% | $6,495,000 | 1.80% | $360,278,000 |
| 2011 | $183,847,000 | 49.85% | $124,825,000 | 33.85% | $43,574,000 | 11.82% | $10,612,000 | 2.88% | $5,907,000 | 1.60% | $368,765,000 |
| 2012 | $186,478,000 | 52.56% | $124,493,000 | 35.09% | $29,689,000 | 8.37% | $8,788,000 | 2.48% | $5,356,000 | 1.51% | $354,804,000 |
| 2013 | $200,026,000 | 50.71% | $130,806,000 | 33.16% | $49,365,000 | 12.51% | $8,596,000 | 2.18% | $5,692,000 | 1.44% | $394,485,000 |
| Avg. | $137,758,429 | 45.92% | $92,802,429 | 30.85% | $51,145,143 | 17.66% | $8,082,952 | 2.67% | $7,878,667 | 2.90% | $297,667,619 |
Debt
The table below shows the amount of debt retired, issued, and outstanding in the district for each year.
| Debt | |||
|---|---|---|---|
| Fiscal Year |
Retired | Issued | Outstanding |
| Click [show] on the right to display the debt data for prior years. | |||
|---|---|---|---|
| 1993 | $76,985,000 | $120,145,000 | $112,335,000 |
| 1994 | $7,810,000 | $0 | $112,335,000 |
| 1995 | $0 | $0 | $112,335,000 |
| 1996 | $0 | $72,499,000 | $112,335,000 |
| 1997 | $11,580,000 | $21,399,000 | $175,513,000 |
| 1998 | $2,890,000 | $4,101,000 | $180,719,000 |
| 1999 | $162,231,000 | $164,932,000 | $182,445,000 |
| 2000 | $12,849,000 | $10,390,000 | $180,971,000 |
| 2001 | $12,864,000 | $0 | $168,106,000 |
| 2002 | $13,494,000 | $49,996,000 | $204,608,000 |
| 2003 | $14,906,000 | $29,000,000 | $218,703,000 |
| 2004 | $15,780,000 | $0 | $202,923,000 |
| 2005 | $16,959,000 | $148,898,000 | $356,046,000 |
| 2006 | $21,184,000 | $48,001,000 | $361,679,000 |
| 2007 | $23,352,000 | $7,820,000 | $346,147,000 |
| 2008 | $22,105,000 | $0 | $324,042,000 |
| 2009 | $55,051,000 | $64,715,000 | $333,706,000 |
| 2010 | $41,173,000 | $0 | $282,833,000 |
| 2011 | $39,838,000 | $7,420,000 | $250,415,000 |
| 2012 | $29,129,000 | $0 | $195,811,000 |
| 2013 | $21,970,000 | $79,997,000 | $254,323,000 |
| Avg. | $28,673,810 | $39,491,095 | $222,301,429 |
Teacher salaries
Clovis Unified School District employed 1,679 teachers in the 2011-2012 school year.[12] Teacher salaries are categorized based on higher education achievement, professional development and years of service. A teacher with a bachelor's degree can earn higher salaries by pursuing graduate courses with raises at credit intervals. The salary schedule also accounts for graduate degrees by providing higher starting salaries and greater potential salaries.
Teachers at Clovis Unified School District do not have a union. Instead, they have a faculty senate who is in charge of negotiating salary schedules with district administration.[13] The following table details the salary schedule negotiated between the district and the faculty senate for the 2014-2015 school year.[14]
| Salary structure | ||
|---|---|---|
| Degree level | Minimum salary ($) | Maximum salary ($) |
| B.A. | 42,456 | 50,424 |
| B.A. + 45 | 43,512 | 57,297 |
| B.A. + 60 or M.A. | 44,568 | 78,782 |
| B.A. + 75 | 45,625 | 80,649 |
| 75 + M.A. | 46,681 | 82,516 |
Schools in Clovis Unified School District
Enrollment
Clovis Unified School District served 40,783 students during the 2013-2014 school year. The table below details the district's total enrollment since the 2009-2010 school year.[1]
| Total enrollment | ||
|---|---|---|
| Year | Enrollment | Year-to-year change (%) |
| 2009-2010 | 38,004 | - |
| 2010-2011 | 38,495 | 1.3 |
| 2011-2012 | 39,040 | 1.4 |
| 2012-2013 | 39,894 | 2.1 |
| 2013-2014 | 40,783 | 2.2 |
District schools
Clovis Unified School District operates 49 schools, which are listed below in alphabetical order:[15]
| Clovis Unified School District | ||
|---|---|---|
| School Name | ||
| Alta Sierra Intermediate | ||
| Buchanan High School | ||
| Bud Rank | ||
| CART | ||
| Cedarwood | ||
| Century | ||
| Clark Intermediate | ||
| Clovis Adult School | ||
| Clovis East High School | ||
| Clovis Elementary | ||
| Clovis High School | ||
| Clovis North High School | ||
| Clovis West High School | ||
| Cole | ||
| Community Day Elementary School | ||
| Community Day Secondary School | ||
| Copper Hills | ||
| Cox | ||
| Dry Creek | ||
| Enterprise High School | ||
| Fancher Creek | ||
| Fort Washington | ||
| Freedom | ||
| Fugman | ||
| Garfield | ||
| Gateway High School | ||
| Gettysburg | ||
| Granite Ridge Intermediate | ||
| Jefferson | ||
| Kastner Intermediate | ||
| Liberty | ||
| Lincoln | ||
| Maple Creek | ||
| Miramonte | ||
| Mountain View | ||
| Nelson | ||
| Oraze | ||
| Pinedale | ||
| Reagan | ||
| Red Bank | ||
| Reyburn Intermediate | ||
| Riverview | ||
| Sierra Outdoor School at 5-Mile Creek | ||
| Sierra Vista | ||
| Tarpey | ||
| Temperance-Kutner | ||
| Valley Oak | ||
| Weldon | ||
| Woods | ||
Academic performance
California STAR program
California's Standardized Testing and Reporting (STAR) program, which includes the California Standards Tests, the California Modified Assessment and the California Alternate Performance Assessment, measures student achievement in grades two through 11 for California's academic content standards. STAR results include English-language arts and mathematics in grades two through 11, science in grades five and eight through 11 and history and social science in grades eight, 10 and 11. In high school, math and science tests reflect the course in which the student is enrolled.
There are five STAR performance benchmarks to indicate a student's academic proficiency. "Proficient" or "Advanced" indicates that a student is meeting or exceeding state standards.[16]
| STAR Results, % of Proficient/Advanced Students, 2012-2013 | ||
|---|---|---|
| Subject | District (%) | State average (%) |
| English-Language Arts | 73 | 55 |
| Mathematics | 69 | 50 |
| Science | 77 | 59 |
| History and Social Science | 62 | 49 |
Issues
Board adopts new dress code policy
In April 2016, the Clovis Unified Board of Education approved an update to the district's dress policy, which had been in place for decades. The policy did not allow boys to wear earrings and required them to have short hair. It also stated that only girls were allowed to wear skirts and dresses. Those requirements were against a law the California State Legislature enacted in 2011 that made "discrimination based on failure to conform to narrow gender stereotypes" illegal, according to The Fresno Bee. The district's new policy eliminated the gender-specific restrictions for hair and jewelry.[17][18]
The approval for the new dress policy came nearly three months after the board voted 4-3 against similar changes in January 2016. Board members Sandra A. Bengel, Betsy Sandoval, Ginny Hovsepian, and Richard Lake voted against the policy change, and a number of district parents voiced their approval of keeping the old policy.[17]
“Just because it’s a law doesn’t mean we need to put up with it. This community is being assaulted from afar with what I believe is an overreaching law regarding gender equity. I believe it’s un-American to run from a fight for a good cause,” said Hovsepian after she voted against changes to the dress policy in January 2016. Those who were in favor of keeping the old policy said there was a link between good grooming and high academic achievement.[17]
Board member Chris Casado, who voted to change the dress policy, said he supported the other board members' opinions. “I think we have potentially left for ourselves some unfriendly future issues that might develop, and I think that our obligation is protecting this district from unnecessary litigation and to follow the law,” Casado said. “If you’re talking about what you believe in your heart and your mind, I agree with everybody up there that voted ‘no’ 100 percent. But that’s not what we were elected to do.”[17]
One person spoke in favor of changing the dress policy at the board's January meeting: school board candidate Isabel Machado. “Honestly, I’m just shocked,” she said. “I heard when I moved out here that this was ‘Clovis,’ and I sometimes still hear that I live in ‘Clovis,’ but guess what Clovis? It’s 2016.”[17]
Abré Conner, an attorney with the American Civil Liberties Union, said she was shocked by the board's vote to keep the old dress policy. “When schools require a certain hair length only for boys, or say that girls can wear earrings but boys cannot wear earrings, they discriminate and prevent students from learning in an inclusive school climate,” said Conner.[17]
Conner said the ACLU would evaluate their next steps, which could have included a lawsuit. The board's vote to change the policy in April 2016, however, brought it in line with the law.[17][18]
Contact information

1450 Herndon Ave.
Clovis, CA 93611
Phone: (559) 327-9000
See also
| California | School Board Elections | News and Analysis |
|---|---|---|
 |
 | |
External links
- Clovis Unified School District
- Clovis, California
- Fresno County, California
- California Department of Education
- California School Boards Association
Footnotes
- ↑ 1.0 1.1 Ed Data, "District Reports: Profile of District," accessed November 14, 2014
- ↑ 2.0 2.1 2.2 United States Census Bureau, "Fresno County, California," accessed June 29, 2016
- ↑ Fresno County Registrar of Voters, "Election Results," accessed July 15, 2014
- ↑ Clovis Roundup, "Eimear O’Farrell named CUSD Superintendent," accessed November 5, 2019
- ↑ Fresno Bee, "Q&A with new Clovis Unified Superintendent Dr. Eimear O’Farrell," accessed November 5, 2019
- ↑ Clovis Unified School District, "Janet Young," accessed November 14, 2014
- ↑ CUSD Today, "Getting to know new CUSD Superintendent Janet Young, Ed.D. – Part I," accessed November 14, 2014 (timed out)
- ↑ Clovis Unified School District, "Governing Board," accessed July 16, 2014
- ↑ Note: This text is quoted verbatim from the original source. Any inconsistencies are attributable to the original source.
- ↑ Clovis Unified School District Policy Center, "1101 - Board Bylaws - Board Policy," accessed November 14, 2014
- ↑ United States Census Bureau, "Public School System Finances: Historical Data," accessed December 1, 2015
- ↑ Ed Data, "District Reports: Teacher Salaries," accessed November 14, 2014
- ↑ California Teachers Empowerment Network, "No contracts in Clovis, Snowline, or Warner Springs –," accessed November 14, 2014
- ↑ Clovis Unified School District, "SCHEDULE A (2014-15) CERTIFICATED SALARY SCHEDULE," accessed November 14, 2014
- ↑ Clovis Unified School District, "School," accessed November 14, 2014
- ↑ Cite error: Invalid
<ref>tag; no text was provided for refs namedreport - ↑ 17.0 17.1 17.2 17.3 17.4 17.5 17.6 The Fresno Bee, "Clovis Unified ready for legal fight over dress code," January 27, 2016
- ↑ 18.0 18.1 ABC 30, "Clovis Unified Enacts New Dress Codes Changes," April 7, 2016
| |||||
 |
State of California Sacramento (capital) |
|---|---|
| Elections |
What's on my ballot? | Elections in 2026 | How to vote | How to run for office | Ballot measures |
| Government |
Who represents me? | U.S. President | U.S. Congress | Federal courts | State executives | State legislature | State and local courts | Counties | Cities | School districts | Public policy |