It’s the 12 Days of Ballotpedia! Your gift powers the trusted, unbiased information voters need heading into 2026. Donate now!
Ohio's 12th Congressional District
| Ohio's 12th Congressional District |
|---|
 |
| Incumbent Vacant Cook Partisan Voter Index (2018): R+7 |
| U.S. Census Bureau (2010 data)[1] |
| Population: 727,728 |
| Gender: 50.7% Female, 49.3% Male |
| Race[2]: 89.2% White, 4.6% Black, 3.0% Asian |
| Ethnicity: 2.0% Hispanic |
| Unemployment: 6.5% |
| Median household income $61,304 |
| High school graduation rate 92.4% |
| College graduation rate 37.0% |
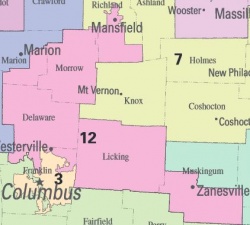
As of the 2010 redistricting cycle, Ohio's 12th Congressional District was located in the central portion of the state and included Delaware, Licking, and Morrow counties with the addition of portions of Franklin, Marion, Muskingum, and Richland counties.[3]
The 12th Congressional District seat is currently vacant. On October 19, 2017, Tiberi announced that he would leave Congress before January 31, 2018, to lead the Ohio Business Roundtable.[4]
Elections
2018
Regular
General election
General election candidates
- Troy Balderson (Incumbent) (Republican Party) ✔
- Danny O'Connor (Democratic Party)
- Joe Manchik (Green Party)

Did not make the ballot:
- Matthew Brendan O'Connor (Libertarian Party)
- Jonathan Veley (Independent)
![]() = candidate completed Ballotpedia's Candidate Connection survey
= candidate completed Ballotpedia's Candidate Connection survey
Write-in candidates
Primary candidates
- See also: Ohio's 12th Congressional District special election (May 8, 2018 Democratic primary)
- See also: Ohio's 12th Congressional District special election (May 8, 2018 Republican primary)
- See also: Ohio's 12th Congressional District election (May 8, 2018 Democratic primary)
- See also: Ohio's 12th Congressional District election (May 8, 2018 Republican primary)
![]() Democratic primary candidates
Democratic primary candidates
Did not make the ballot:
![]() Republican primary candidates
Republican primary candidates
- Troy Balderson (Incumbent) ✔
- John Adams
- Kevin Bacon
- Lawrence Cohen
- Jon Halverstadt
- Tim Kane
- Melanie Leneghan
- Pat Manley
- Carol O'Brien
- Mick Shoemaker Jr.
Did not make the ballot:
Minor Party general election candidates
Did not make the ballot:
- Jonathan Veley Independent
- Matthew Brendan O'Connor Libertarian Party
![]() = candidate completed Ballotpedia's Candidate Connection survey
= candidate completed Ballotpedia's Candidate Connection survey
2018 Special
This election is being held to replace Patrick Tiberi (R). On October 19, 2017, Tiberi announced that he would leave Congress before January 31, 2018, to lead the Ohio Business Roundtable.[5]
A total of 17 candidates filed in the race, six Democratic candidates, 10 Republican candidates, and one Green Party candidate.[6] The filing deadline was on February 7, 2018, and the primary election took place on May 8, 2018.
2016
Heading into the election, Ballotpedia rated this race as safely Republican. Incumbent Patrick Tiberi (R) defeated Ed Albertson (D) and Joe Manchik (Green) in the general election. All three candidates ran unopposed in their respective primaries.[7]
| Party | Candidate | Vote % | Votes | |
|---|---|---|---|---|
| Republican | 66.6% | 251,266 | ||
| Democratic | Ed Albertson | 29.8% | 112,638 | |
| Green | Joe Manchik | 3.6% | 13,474 | |
| N/A | Write-in | 0% | 156 | |
| Total Votes | 377,534 | |||
| Source: Ohio Secretary of State | ||||
2014
The 12th Congressional District of Ohio held an election for the U.S. House of Representatives on November 4, 2014. Incumbent Patrick Tiberi (R) defeated David Tibbs (D) and Bob Hart (G) in the general election.
| Party | Candidate | Vote % | Votes | |
|---|---|---|---|---|
| Republican | 68.1% | 150,573 | ||
| Democratic | David Tibbs | 27.8% | 61,360 | |
| Green | Bob Hart | 4.1% | 9,148 | |
| Total Votes | 221,081 | |||
| Source: Ohio Secretary of State | ||||
2012
The 12th Congressional District of Ohio held an election for the U.S. House of Representatives on November 6, 2012. Incumbent Patrick J. Tiberi won re-election in the district.[8]
| Party | Candidate | Vote % | Votes | |
|---|---|---|---|---|
| Democratic | James Reese | 36.5% | 134,605 | |
| Republican | 63.5% | 233,869 | ||
| Total Votes | 368,474 | |||
| Source: Ohio Secretary of State "Official Election Results, 2012 General Election" | ||||
2010
On November 2, 2010, Patrick Tiberi won re-election to the United States House. He defeated Paula Brooks (D) and Travis Irvine (L) in the general election.[9]
| U.S. House, Ohio District 12 General Election, 2010 | ||||
|---|---|---|---|---|
| Party | Candidate | Vote % | Votes | |
| Republican | 55.8% | 150,163 | ||
| Democratic | Paula Brooks | 41% | 110,307 | |
| Libertarian | Travis M. Irvine | 3.2% | 8,710 | |
| Total Votes | 269,180 | |||
2008
On November 4, 2008, Patrick Tiberi won re-election to the United States House. He defeated David Robinson (D) and Steven Linnaberry (L) in the general election.[10]
| U.S. House, Ohio District 12 General Election, 2008 | ||||
|---|---|---|---|---|
| Party | Candidate | Vote % | Votes | |
| Republican | 54.8% | 197,447 | ||
| Democratic | David Robinson | 42.2% | 152,234 | |
| Libertarian | Steven Linnaberry | 3% | 10,707 | |
| Total Votes | 360,388 | |||
2006
On November 7, 2006, Patrick Tiberi won re-election to the United States House. He defeated Bob Shamansky (D) in the general election.[11]
| U.S. House, Ohio District 12 General Election, 2006 | ||||
|---|---|---|---|---|
| Party | Candidate | Vote % | Votes | |
| Republican | 57.3% | 145,943 | ||
| Democratic | Bob Shamansky | 42.7% | 108,746 | |
| Total Votes | 254,689 | |||
2004
On November 2, 2004, Patrick Tiberi won re-election to the United States House. He defeated Edward Brown (D) and Chuck Spingola (nonpartisan) in the general election.[12]
| U.S. House, Ohio District 12 General Election, 2004 | ||||
|---|---|---|---|---|
| Party | Candidate | Vote % | Votes | |
| Republican | 62% | 198,912 | ||
| Democratic | Edward Brown | 38% | 122,109 | |
| Nonpartisan | Chuck Spingola | 0% | 25 | |
| Total Votes | 321,046 | |||
2002
On November 5, 2002, Patrick Tiberi won re-election to the United States House. He defeated Edward Brown (D) in the general election.[13]
| U.S. House, Ohio District 12 General Election, 2002 | ||||
|---|---|---|---|---|
| Party | Candidate | Vote % | Votes | |
| Republican | 64.4% | 116,982 | ||
| Democratic | Edward Brown | 35.6% | 64,707 | |
| Total Votes | 181,689 | |||
2000
On November 7, 2000, Patrick Tiberi won election to the United States House. He defeated Maryellen O'Shaughnessy (D), Nick Hogan (L), Gregory Richey (Natural Law) and Charles Jordan (I) in the general election.[14]
| U.S. House, Ohio District 12 General Election, 2000 | ||||
|---|---|---|---|---|
| Party | Candidate | Vote % | Votes | |
| Republican | 52.9% | 139,242 | ||
| Democratic | Maryellen O'Shaughnessy | 43.8% | 115,432 | |
| Libertarian | Nick Hogan | 1.7% | 4,546 | |
| Natural Law | Gregory Richey | 1% | 2,600 | |
| Independent | Charles Jordan | 0.6% | 1,566 | |
| Total Votes | 263,386 | |||
Redistricting
2010-2011

- See also: Redistricting in Ohio
The Ohio State Legislature approved a new map of the congressional districts based on updated population information from the 2010 census.[15]
District analysis
- See also: The Cook Political Report's Partisan Voter Index
- See also: FiveThirtyEight's elasticity scores
The 2017 Cook Partisan Voter Index for this district was R+7, meaning that in the previous two presidential elections, this district's results were 7 percentage points more Republican than the national average. This made Ohio's 12th Congressional District the 171st most Republican nationally.[16]
FiveThirtyEight's September 2018 elasticity score for states and congressional districts measured "how sensitive it is to changes in the national political environment." This district's elasticity score was 0.97. This means that for every 1 point the national political mood moved toward a party, the district was expected to move 0.97 points toward that party.[17]
See also
External links
Footnotes
- ↑ Demographic data were added to this page in 2013. Ballotpedia will update this page in 2021 after data from the 2020 Census become available.
- ↑ Note: Percentages for race and ethnicity may add up to more than 100 percent because respondents may report more than one race and the Hispanic/Latino ethnicity may be selected in conjunction with any race. Read more about race and ethnicity in the census here.
- ↑ Ohio Redistricting Map, "Map," accessed August 9, 2012
- ↑ The Hill, "Ohio Republican Tiberi to leave Congress," October 19, 2017
- ↑ The Hill, "Ohio Republican Tiberi to leave Congress," October 19, 2017
- ↑ Franklin County Board of Elections, "2018 Primary - Candidates Filed," accessed February 10, 2018
- ↑ Ohio Secretary of State, "Ohio 2016 March Primary Candidate List," accessed March 11, 2016
- ↑ Politico, "2012 Election Map, Ohio," accessed November 11, 2012
- ↑ U.S. Congress House Clerk, "Statistics of the Congressional Election of November 2, 2010," accessed March 28, 2013
- ↑ U.S. Congress House Clerk, "Statistics of the Congressional Election of November 4, 2008," accessed March 28, 2013
- ↑ U.S. Congress House Clerk, "Statistics of the Congressional Election of November 7, 2006," accessed March 28, 2013
- ↑ U.S. Congress House Clerk, "Statistics of the Congressional Election of November 2, 2004," accessed March 28, 2013
- ↑ U.S. Congress House Clerk, "Statistics of the Congressional Election of November 5, 2002," accessed March 28, 2013
- ↑ U.S. Congress House Clerk, "Statistics of the Congressional Election of November 7, 2000," accessed March 28, 2013
- ↑ Washington Times, "Ohio redistricting sets up battles of incumbents," accessed December 21, 2011
- ↑ Cook Political Report, "Introducing the 2017 Cook Political Report Partisan Voter Index," April 7, 2017
- ↑ FiveThirtyEight, "Election Update: The Most (And Least) Elastic States And Districts," September 6, 2018