Tennessee's 1st Congressional District election, 2024 (August 1 Republican primary)
U.S. Senate • U.S. House • State Senate • State House • Supreme court • Appellate courts • Local ballot measures • School boards • Municipal • How to run for office |
2026 →
← 2022
|
| Tennessee's 1st Congressional District |
|---|
| Democratic primary Republican primary General election |
| Election details |
| Filing deadline: April 4, 2024 |
| Primary: August 1, 2024 General: November 5, 2024 |
| How to vote |
| Poll times: Varies by county Voting in Tennessee |
| Race ratings |
DDHQ and The Hill: Safe Republican Inside Elections: Solid Republican Sabato's Crystal Ball: Safe Republican |
| Ballotpedia analysis |
| U.S. Senate battlegrounds U.S. House battlegrounds Federal and state primary competitiveness Ballotpedia's Election Analysis Hub, 2024 |
| See also |
U.S. Senate • 1st • 2nd • 3rd • 4th • 5th • 6th • 7th • 8th • 9th Tennessee elections, 2024 U.S. Congress elections, 2024 U.S. Senate elections, 2024 U.S. House elections, 2024 |
A Republican Party primary took place on August 1, 2024, in Tennessee's 1st Congressional District to determine which Republican candidate would run in the district's general election on November 5, 2024.
Incumbent Diana Harshbarger advanced from the Republican primary for U.S. House Tennessee District 1.
All 435 seats were up for election. At the time of the election, Republicans had a 220 to 212 majority with three vacancies.[1] As of June 2024, 45 members of the U.S. House had announced they were not running for re-election. To read more about the U.S. House elections taking place this year, click here.
In the 2022 election in this district, the Republican candidate won 78.3%-19.7%. Daily Kos calculated what the results of the 2020 presidential election in this district would have been following redistricting. Donald Trump (R) would have defeated Joe Biden (D) 76.3%-22.0%.[2]
| Candidate filing deadline | Primary election | General election |
|---|---|---|
A primary election is an election in which registered voters select a candidate that they believe should be a political party's candidate for elected office to run in the general election. They are also used to choose convention delegates and party leaders. Primaries are state-level and local-level elections that take place prior to a general election. Tennessee utilizes a closed primary process; a voter must either be registered with a political party or must declare his or affiliation with the party at the polls on primary election day in order to vote in that party's primary.[3]
For information about which offices are nominated via primary election, see this article.
This page focuses on Tennessee's 1st Congressional District Republican primary. For more in-depth information on the district's Democratic primary and the general election, see the following pages:
- Tennessee's 1st Congressional District election, 2024 (August 1 Democratic primary)
- Tennessee's 1st Congressional District election, 2024
Candidates and election results
Republican primary election
Republican primary for U.S. House Tennessee District 1
Incumbent Diana Harshbarger advanced from the Republican primary for U.S. House Tennessee District 1 on August 1, 2024.
Candidate | % | Votes | ||
| ✔ |  | Diana Harshbarger | 100.0 | 52,190 |
| Total votes: 52,190 | |||
| If you are a candidate and would like to tell readers and voters more about why they should vote for you, complete the Ballotpedia Candidate Connection Survey. | ||||
Do you want a spreadsheet of this type of data? Contact our sales team. | ||||
Candidate profiles
There were no candidate profiles created for this race. Candidate profiles would have appeared here as candidates completed Ballotpedia's Candidate Connection survey.
Voting information
- See also: Voting in Tennessee
Campaign finance
| Name | Party | Receipts* | Disbursements** | Cash on hand | Date |
|---|---|---|---|---|---|
| Diana Harshbarger | Republican Party | $1,930,833 | $1,415,175 | $1,450,769 | As of December 31, 2024 |
|
Source: Federal Elections Commission, "Campaign finance data," 2024. This product uses the openFEC API but is not endorsed or certified by the Federal Election Commission (FEC).
* According to the FEC, "Receipts are anything of value (money, goods, services or property) received by a political committee." |
|||||
District analysis
Click the tabs below to view information about voter composition, past elections, and demographics in both the district and the state.
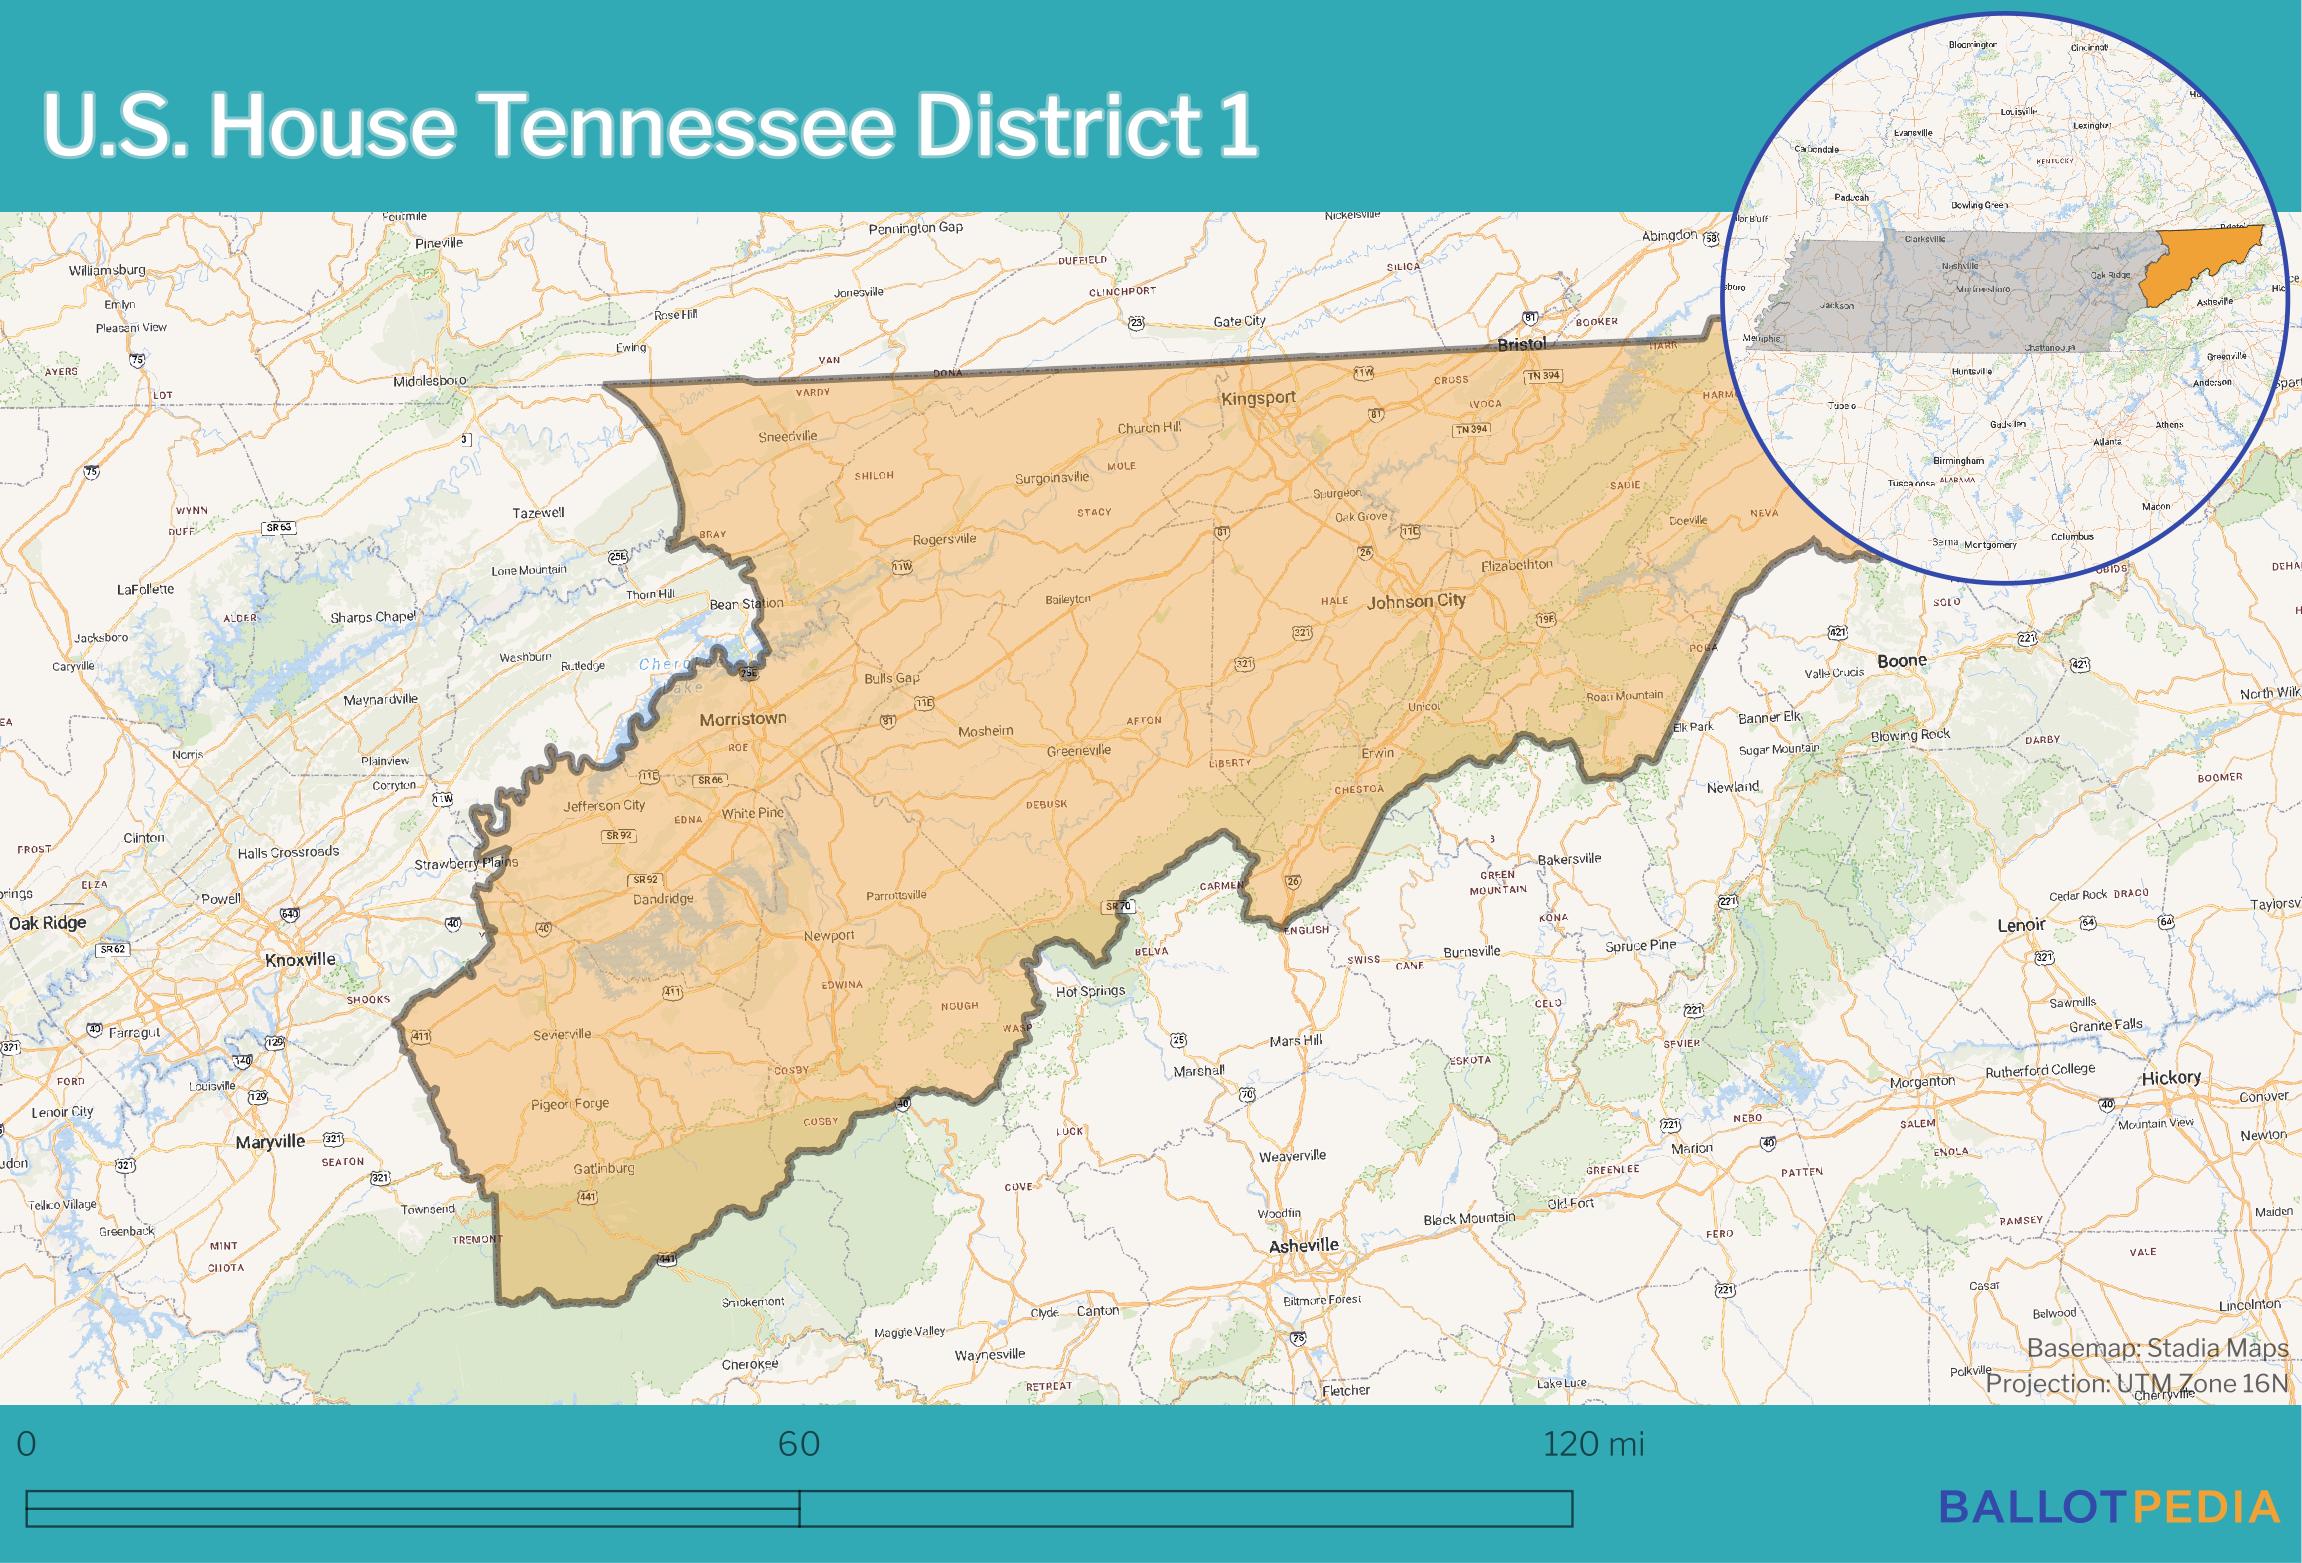
- District map - A map of the district in place for the election.
- Competitiveness - Information about the competitiveness of 2024 U.S. House elections in the state.
- Presidential elections - Information about presidential elections in the district and the state.
- State party control - The partisan makeup of the state's congressional delegation and state government.
Below was the map in use at the time of the election. Click the map below to enlarge it.
This section contains data on U.S. House primary election competitiveness in Tennessee.
| Tennessee U.S. House competitiveness, 2014-2024 | ||||||||||||||
|---|---|---|---|---|---|---|---|---|---|---|---|---|---|---|
| Office | Districts/ offices |
Seats | Open seats | Candidates | Possible primaries | Contested Democratic primaries | Contested Republican primaries | % of contested primaries | Incumbents in contested primaries | % of incumbents in contested primaries | ||||
| 2024 | 9 | 9 | 0 | 31 | 18 | 4 | 2 | 33.3% | 3 | 33.3% | ||||
| 2022 | 9 | 9 | 1 | 36 | 18 | 4 | 4 | 44.4% | 3 | 37.5% | ||||
| 2020 | 9 | 9 | 2 | 45 | 18 | 6 | 2 | 44.4% | 3 | 42.9% | ||||
| 2018 | 9 | 9 | 2 | 49 | 18 | 6 | 7 | 72.2% | 5 | 71.4% | ||||
| 2016 | 9 | 9 | 2 | 48 | 18 | 4 | 6 | 55.6% | 5 | 71.4% | ||||
| 2014 | 9 | 9 | 0 | 39 | 18 | 3 | 8 | 61.1% | 8 | 88.9% | ||||
Post-filing deadline analysis
The following analysis covers all U.S. House districts up for election in Tennessee in 2024. Information below was calculated on May 2, 2024, and may differ from information shown in the table above due to candidate replacements and withdrawals after that time.
Thirty-one candidates ran for Tennessee’s nine U.S. House districts, including 19 Democrats and 12 Republicans. That’s 3.4 candidates per district, less than in the previous three election cycles. There were 4.0 candidates per district in 2022, 5.0 candidates per district in 2020, and 5.4 in 2018.
The number of candidates who ran for the U.S. House in Tennessee in 2024 is also lower than any other year this decade.
No seats were open in 2024, meaning all incumbents ran for re-election. The last time all incumbents ran for re-election in Tennessee was in 2014.
Six candidates—five Democrats and one Republican—ran for the 8th Congressional District, the most candidates who ran for a seat in Tennessee in 2024.
Six primaries—four Democratic and two Republican—were contested in 2024, the fewest this decade. There were eight contested primaries in 2022, eight in 2020, 13 in 2018, 10 in 2016, and 11 in 2014.
Three incumbents—one Democrat and two Republicans—were in contested primaries in 2024. That’s the same as the previous two election cycles.
Candidates filed to run in the Republican and Democratic primaries in all eight districts, meaning no seats were guaranteed to either party.Partisan Voter Index
Heading into the 2024 elections, based on results from the 2020 and 2016 presidential elections, the Cook Partisan Voter Index for this district was R+30. This meant that in those two presidential elections, this district's results were 30 percentage points more Republican than the national average. This made Tennessee's 1st the 3rd most Republican district nationally.[4]
2020 presidential election results
The table below shows what the vote in the 2020 presidential election would have been in this district. The presidential election data was compiled by Daily Kos.
| 2020 presidential results in Tennessee's 1st based on 2024 district lines | ||||
|---|---|---|---|---|
| Joe Biden |
Donald Trump | |||
| 22.0% | 76.3% | |||
Inside Elections Baselines
- See also: Inside Elections
Inside Elections' Baseline is a figure that analyzes all federal and statewide election results from the district over the past four election cycles. The results are combined in an index estimating the strength of a typical Democratic or Republican candidate in the congressional district.[5] The table below displays the Baseline data for this district.
| Inside Elections Baseline for 2024 | ||||
|---|---|---|---|---|
| Democratic Baseline |
Republican Baseline |
Difference | ||
| 21.0 | 76.9 | R+55.9 | ||
Presidential voting history
- See also: Presidential election in Tennessee, 2020
Tennessee presidential election results (1900-2020)
- 15 Democratic wins
- 16 Republican wins
| Year | 1900 | 1904 | 1908 | 1912 | 1916 | 1920 | 1924 | 1928 | 1932 | 1936 | 1940 | 1944 | 1948 | 1952 | 1956 | 1960 | 1964 | 1968 | 1972 | 1976 | 1980 | 1984 | 1988 | 1992 | 1996 | 2000 | 2004 | 2008 | 2012 | 2016 | 2020 |
|---|---|---|---|---|---|---|---|---|---|---|---|---|---|---|---|---|---|---|---|---|---|---|---|---|---|---|---|---|---|---|---|
| Winning Party | D | D | D | D | D | R | D | R | D | D | D | D | D | R | R | R | D | R | R | D | R | R | R | D | D | R | R | R | R | R | R |
Congressional delegation
The table below displays the partisan composition of Tennessee's congressional delegation as of May 2024.
| Congressional Partisan Breakdown from Tennessee | |||
|---|---|---|---|
| Party | U.S. Senate | U.S. House | Total |
| Democratic | 0 | 1 | 1 |
| Republican | 2 | 8 | 10 |
| Independent | 0 | 0 | 0 |
| Vacancies | 0 | 0 | 0 |
| Total | 2 | 9 | 11 |
State executive
The table below displays the officeholders in Tennessee's top three state executive offices as of May 2024.
| State executive officials in Tennessee, May 2024 | |
|---|---|
| Office | Officeholder |
| Governor | |
| Secretary of State | |
| Attorney General | |
State legislature
Tennessee State Senate
| Party | As of February 2024 | |
|---|---|---|
| Democratic Party | 6 | |
| Republican Party | 27 | |
| Other | 0 | |
| Vacancies | 0 | |
| Total | 33 | |
Tennessee House of Representatives
| Party | As of February 2024 | |
|---|---|---|
| Democratic Party | 24 | |
| Republican Party | 75 | |
| Independent | 0 | |
| Other | 0 | |
| Vacancies | 0 | |
| Total | 99 | |
Trifecta control
The table below shows the state's trifecta status from 1992 until the 2024 election.
Tennessee Party Control: 1992-2024
Five years of Democratic trifectas • Fourteen years of Republican trifectas
Scroll left and right on the table below to view more years.
| Year | 92 | 93 | 94 | 95 | 96 | 97 | 98 | 99 | 00 | 01 | 02 | 03 | 04 | 05 | 06 | 07 | 08 | 09 | 10 | 11 | 12 | 13 | 14 | 15 | 16 | 17 | 18 | 19 | 20 | 21 | 22 | 23 | 24 |
|---|---|---|---|---|---|---|---|---|---|---|---|---|---|---|---|---|---|---|---|---|---|---|---|---|---|---|---|---|---|---|---|---|---|
| Governor | D | D | D | R | R | R | R | R | R | R | R | D | D | D | D | D | D | D | D | R | R | R | R | R | R | R | R | R | R | R | R | R | R |
| Senate | D | D | D | D | R | D | D | D | D | D | D | D | D | R | R | S | S | R | R | R | R | R | R | R | R | R | R | R | R | R | R | R | R |
| House | D | D | D | D | D | D | D | D | D | D | D | D | D | D | D | D | D | D | R | R | R | R | R | R | R | R | R | R | R | R | R | R | R |
Ballot access
The table below details filing requirements for U.S. House candidates in Tennessee in the 2024 election cycle. For additional information on candidate ballot access requirements in Tennessee, click here.
| Filing requirements for U.S. House candidates, 2024 | ||||||
|---|---|---|---|---|---|---|
| State | Office | Party | Signatures required | Filing fee | Filing deadline | Source |
| Tennessee | U.S. House | All candidates | 25 | N/A | 4/4/2024 | Source |
See also
- Tennessee's 1st Congressional District election, 2024 (August 1 Democratic primary)
- Tennessee's 1st Congressional District election, 2024
- United States House elections in Tennessee, 2024 (August 1 Democratic primaries)
- United States House elections in Tennessee, 2024 (August 1 Republican primaries)
- United States House Democratic Party primaries, 2024
- United States House Republican Party primaries, 2024
- United States House of Representatives elections, 2024
- U.S. House battlegrounds, 2024
External links
Footnotes
- ↑ A majority in the U.S. House when there are no vacancies is 218 seats.
- ↑ Daily Kos, "Daily Kos Elections' 2020 presidential results by congressional district, for new and old districts," accessed September 15, 2022
- ↑ LexisNexis, "Tenn. Code Ann. § 2-7-115," accessed July 16, 2025
- ↑ Cook Political Report, "The 2022 Cook Partisan Voting Index (Cook PVI℠)," accessed January 10, 2024
- ↑ Inside Elections, "Methodology: Inside Elections’ Baseline by Congressional District," December 8, 2023

