Eagle Pass Independent School District, Texas: Difference between revisions
m (Text replacement - "===School board elections===" to "===Election dates===") |
(local coverage disclaimer) |
||
| Line 1: | Line 1: | ||
{{Local scope archive|Type=School district}} | |||
{{School board district infobox | {{School board district infobox | ||
|District = Eagle Pass Independent School District | |District = Eagle Pass Independent School District | ||
Revision as of 21:27, 9 April 2018
Ballotpedia provides comprehensive election coverage of the 100 largest cities in America by population as well as mayoral, city council, and district attorney election coverage in state capitals outside of the 100 largest cities. This school district is outside of that coverage scope and does not receive scheduled updates.
| Eagle Pass Independent School District |
|---|
| Maverick County, Texas |
| District details |
| Superintendent: Gilberto Gonzalez |
| # of school board members: 7 |
| Website: Link |
Eagle Pass Independent School District is a school district in Texas that served 15,094 students in 23 schools during the 2012-2013 school year.[1] This district was the 76th-largest by enrollment in the state of Texas.
About the district
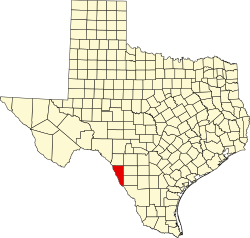
Eagle Pass Independent School District is located in Maverick County, Texas. The county seat is Eagle Pass. Maverick County was home to 56,510 residents in 2013, according to the United States Census Bureau.[2]
Demographics
Maverick County underperformed in comparison to the rest of Texas in terms of higher education achievement in 2013. The United States Census Bureau found that 12.2 percent of county residents aged 25 years and older had attained a bachelor's degree compared to 26.7 percent for Texas as a whole. The median household income was $31,395 compared to $51,900 for the state of Texas. The poverty rate in Maverick County was 30.5 percent compared to 17.6 percent for the entire state.[2]
|
| |||||||||||||||||||||||||||||||||||||||||||||||||||
Note: Percentages for race and ethnicity may add up to more than 100 percent because respondents may report more than one race and the Hispanic/Latino ethnicity may be selected in conjunction with any race. Read more about race and ethnicity in the census here.
Superintendent
| |
This information is updated as we become aware of changes. Please contact us with any updates. |
The superintendent of Eagle Pass Independent School District is Gilberto Gonzalez, who was appointed to the position in 2012. Gonzalez has a background in education, having served as an educator and counselor in the district and as a counselor in Uvalde Consolidated Independent School District. Most recently, he served as the district's executive director for human resources. He has his bachelor's degree in political science from Texas A&I University and his master's degree in counseling from Sul Ross State University. Gonzalez also has mid-management and superintendency certificates from Sul Ross State University.[4]
School board elections
Eagle Pass Independent School District is overseen by a seven-member board. Although elected to numbered seats, the members serve the district at large. They are elected to four-year terms without compensation.[5]
| Eagle Pass Board of Trustees | ||
|---|---|---|
| Member | Place # | Term ends |
| Lupita Fuentes | 5 | 2018 |
| Hilda Martinez-Caballero | 4 | 2018 |
| Hector Alvarez | 6 | 2020 |
| Glenna Purcell | 7 | 2020 |
| Humberto Torralba Jr. | 1 | 2018 |
| Christopher Hiller | 2 | 2020 |
| Rudy Bowles | 3 | 2018 |
| |
This officeholder information was last updated on April 9, 2018. Please contact us with any updates. | |
Election dates
Members of the Donna Board of Trustees are elected to four-year terms. Four seats were up for election on November 4, 2014, and four seats were up for election on November 8, 2016.
Public participation in board meetings
The board maintains the following policy regarding public participation in board meetings. It was last revised in 2014.
| “ | Citizens' Communication at Board Meetings A citizens’ communication period will be available for 40 minutes during the first section of the agenda. The Board may vote to extend the time of the meeting. Any person, including District faculty and staff, may address the Board on any subject including items not listed on the agenda during the period allowed for citizens’ communication in accordance with the following procedures: |
” |
| —Eagle Pass Independent School District's website, (2014) | ||
Budget
From 1993 to 2013, the Eagle Pass Independent School District had an average of $97,940,571 in revenue and $99,857,857 in expenditures, according to the United States Census Bureau's survey of school system finances. The district had a yearly average of $35,855,476 in outstanding debt. The district retired $2,852,381 of its debt and issued $5,828,810 in new debt each year on average.[8]
Revenue
The table below separates the district's revenue into the three sources identified by the agency: local, state, and federal.
| Revenue by Source | |||||||||||
|---|---|---|---|---|---|---|---|---|---|---|---|
| Fiscal Year |
Local | State | Federal | Revenue Total | |||||||
| Total | % of Revenue | Total | % of Revenue | Total | % of Revenue | ||||||
| Click [show] on the right to display the revenue data for prior years. | |||||||||||
|---|---|---|---|---|---|---|---|---|---|---|---|
| 1993 | $6,682,000 | 11.01% | $45,997,000 | 75.76% | $8,033,000 | 13.23% | $60,712,000 | ||||
| 1994 | $8,442,000 | 14.65% | $38,894,000 | 67.49% | $10,296,000 | 17.87% | $57,632,000 | ||||
| 1995 | $8,537,000 | 14.69% | $39,908,000 | 68.65% | $9,689,000 | 16.67% | $58,134,000 | ||||
| 1996 | $10,011,000 | 16.16% | $42,101,000 | 67.95% | $9,845,000 | 15.89% | $61,957,000 | ||||
| 1997 | $10,813,000 | 16.87% | $43,482,000 | 67.86% | $9,785,000 | 15.27% | $64,080,000 | ||||
| 1998 | $13,004,000 | 18.18% | $48,384,000 | 67.66% | $10,122,000 | 14.15% | $71,510,000 | ||||
| 1999 | $10,221,000 | 14.69% | $48,019,000 | 69.04% | $11,317,000 | 16.27% | $69,557,000 | ||||
| 2000 | $10,226,000 | 13.07% | $55,700,000 | 71.17% | $12,335,000 | 15.76% | $78,261,000 | ||||
| 2001 | $12,720,000 | 15.77% | $55,411,000 | 68.71% | $12,511,000 | 15.51% | $80,642,000 | ||||
| 2002 | $13,908,000 | 16.01% | $58,469,000 | 67.29% | $14,512,000 | 16.70% | $86,889,000 | ||||
| 2003 | $14,757,000 | 15.62% | $62,405,000 | 66.05% | $17,321,000 | 18.33% | $94,483,000 | ||||
| 2004 | $15,308,000 | 14.70% | $69,464,000 | 66.71% | $19,354,000 | 18.59% | $104,126,000 | ||||
| 2005 | $16,824,000 | 15.51% | $70,810,000 | 65.29% | $20,813,000 | 19.19% | $108,447,000 | ||||
| 2006 | $18,402,000 | 16.75% | $70,222,000 | 63.93% | $21,223,000 | 19.32% | $109,847,000 | ||||
| 2007 | $20,478,000 | 17.41% | $75,834,000 | 64.48% | $21,297,000 | 18.11% | $117,609,000 | ||||
| 2008 | $21,768,000 | 15.78% | $95,041,000 | 68.91% | $21,121,000 | 15.31% | $137,930,000 | ||||
| 2009 | $21,716,000 | 16.04% | $91,750,000 | 67.76% | $21,934,000 | 16.20% | $135,400,000 | ||||
| 2010 | $22,164,000 | 15.28% | $90,147,000 | 62.16% | $32,713,000 | 22.56% | $145,024,000 |
| 2011 | $21,920,000 | 15.29% | $91,212,000 | 63.61% | $30,269,000 | 21.11% | $143,401,000 |
| 2012 | $22,197,000 | 16.58% | $90,450,000 | 67.55% | $21,256,000 | 15.87% | $133,903,000 |
| 2013 | $23,286,000 | 16.97% | $93,503,000 | 68.15% | $20,419,000 | 14.88% | $137,208,000 |
| Avg. | $15,399,238 | 15.57% | $65,581,095 | 67.44% | $16,960,238 | 16.99% | $97,940,571 |
Expenditures
The table below separates the district's expenditures into five categories identified by the agency:
- Instruction: operation expenditures, state payments on behalf of the district for instruction and benefits, and retirement system transfers
- Support Services: support services, food services, and retirement system transfers for support service staff
- Capital Spending: capital outlay expenditures (i.e., construction, land or facilities purchases, and equipment purchases)
- Debt & Gov. Payments: payments to state and local governments and interest on school system debt
- Other: all other non-K-12 programs, except food services
| Expenditures by Category | |||||||||||
|---|---|---|---|---|---|---|---|---|---|---|---|
| Fiscal Year |
Instruction | Support Services | Capital Spending | Debt & Gov. Payments | Other | Budget Total | |||||
| Total | % of Budget | Total | % of Budget | Total | % of Budget | Total | % of Budget | Total | % of Budget | ||
| Click [show] on the right to display the expenditure data for prior years. | |||||||||||
|---|---|---|---|---|---|---|---|---|---|---|---|
| 1993 | $25,774,000 | 49.29% | $17,425,000 | 33.32% | $8,200,000 | 15.68% | $248,000 | 0.47% | $646,000 | 1.24% | $52,293,000 |
| 1994 | $28,778,000 | 49.72% | $22,225,000 | 38.40% | $5,880,000 | 10.16% | $161,000 | 0.28% | $835,000 | 1.44% | $57,879,000 |
| 1995 | $31,592,000 | 55.31% | $19,526,000 | 34.18% | $4,933,000 | 8.64% | $153,000 | 0.27% | $917,000 | 1.61% | $57,121,000 |
| 1996 | $34,348,000 | 55.42% | $20,894,000 | 33.71% | $5,189,000 | 8.37% | $580,000 | 0.94% | $969,000 | 1.56% | $61,980,000 |
| 1997 | $35,335,000 | 50.27% | $21,548,000 | 30.66% | $11,810,000 | 16.80% | $418,000 | 0.59% | $1,175,000 | 1.67% | $70,286,000 |
| 1998 | $37,207,000 | 46.83% | $23,427,000 | 29.49% | $16,309,000 | 20.53% | $1,342,000 | 1.69% | $1,158,000 | 1.46% | $79,443,000 |
| 1999 | $39,405,000 | 46.85% | $25,226,000 | 29.99% | $16,378,000 | 19.47% | $1,407,000 | 1.67% | $1,695,000 | 2.02% | $84,111,000 |
| 2000 | $44,104,000 | 56.47% | $27,013,000 | 34.59% | $3,931,000 | 5.03% | $1,332,000 | 1.71% | $1,720,000 | 2.20% | $78,100,000 |
| 2001 | $46,806,000 | 52.85% | $29,436,000 | 33.23% | $8,370,000 | 9.45% | $2,196,000 | 2.48% | $1,763,000 | 1.99% | $88,571,000 |
| 2002 | $48,819,000 | 51.51% | $29,533,000 | 31.16% | $12,811,000 | 13.52% | $2,076,000 | 2.19% | $1,528,000 | 1.61% | $94,767,000 |
| 2003 | $51,740,000 | 57.53% | $33,825,000 | 37.61% | $620,000 | 0.69% | $1,943,000 | 2.16% | $1,811,000 | 2.01% | $89,939,000 |
| 2004 | $54,310,000 | 56.59% | $36,238,000 | 37.76% | $1,528,000 | 1.59% | $1,865,000 | 1.94% | $2,036,000 | 2.12% | $95,977,000 |
| 2005 | $59,139,000 | 57.30% | $38,585,000 | 37.39% | $1,568,000 | 1.52% | $1,472,000 | 1.43% | $2,441,000 | 2.37% | $103,205,000 |
| 2006 | $64,437,000 | 56.73% | $41,513,000 | 36.55% | $3,890,000 | 3.42% | $1,440,000 | 1.27% | $2,312,000 | 2.04% | $113,592,000 |
| 2007 | $65,837,000 | 56.35% | $43,103,000 | 36.89% | $4,254,000 | 3.64% | $1,209,000 | 1.03% | $2,440,000 | 2.09% | $116,843,000 |
| 2008 | $72,296,000 | 56.01% | $47,483,000 | 36.79% | $5,004,000 | 3.88% | $1,573,000 | 1.22% | $2,721,000 | 2.11% | $129,077,000 |
| 2009 | $74,552,000 | 50.08% | $49,238,000 | 33.08% | $18,387,000 | 12.35% | $3,935,000 | 2.64% | $2,753,000 | 1.85% | $148,865,000 |
| 2010 | $78,925,000 | 46.53% | $50,758,000 | 29.93% | $32,806,000 | 19.34% | $4,371,000 | 2.58% | $2,749,000 | 1.62% | $169,609,000 |
| 2011 | $74,918,000 | 52.41% | $50,001,000 | 34.98% | $11,814,000 | 8.26% | $3,611,000 | 2.53% | $2,599,000 | 1.82% | $142,943,000 |
| 2012 | $71,627,000 | 54.44% | $48,635,000 | 36.96% | $5,841,000 | 4.44% | $3,111,000 | 2.36% | $2,361,000 | 1.79% | $131,575,000 |
| 2013 | $73,779,000 | 56.39% | $50,082,000 | 38.28% | $1,575,000 | 1.20% | $3,002,000 | 2.29% | $2,401,000 | 1.84% | $130,839,000 |
| Avg. | $53,034,667 | 53.09% | $34,557,810 | 34.52% | $8,623,714 | 8.95% | $1,783,095 | 1.61% | $1,858,571 | 1.83% | $99,857,857 |
Debt
The table below shows the amount of debt retired, issued, and outstanding in the district for each year.
| Debt | |||
|---|---|---|---|
| Fiscal Year |
Retired | Issued | Outstanding |
| Click [show] on the right to display the debt data for prior years. | |||
|---|---|---|---|
| 1993 | $0 | $0 | $2,835,000 |
| 1994 | $0 | $0 | $2,641,000 |
| 1995 | $0 | $0 | $2,907,000 |
| 1996 | $350,000 | $8,000,000 | $10,199,000 |
| 1997 | $295,000 | $0 | $7,355,000 |
| 1998 | $1,025,000 | $18,000,000 | $24,330,000 |
| 1999 | $915,000 | $0 | $23,415,000 |
| 2000 | $985,000 | $0 | $22,430,000 |
| 2001 | $1,540,000 | $18,000,000 | $38,890,000 |
| 2002 | $1,635,000 | $0 | $39,489,000 |
| 2003 | $1,730,000 | $0 | $37,704,000 |
| 2004 | $6,135,000 | $4,310,000 | $35,963,000 |
| 2005 | $24,370,000 | $22,295,000 | $34,245,000 |
| 2006 | $2,135,000 | $0 | $32,149,000 |
| 2007 | $2,360,000 | $0 | $29,998,000 |
| 2008 | $2,480,000 | $21,800,000 | $49,813,000 |
| 2009 | $2,976,000 | $30,000,000 | $77,493,000 |
| 2010 | $2,544,000 | $0 | $74,169,000 |
| 2011 | $2,435,000 | $0 | $71,840,000 |
| 2012 | $2,940,000 | $0 | $68,979,000 |
| 2013 | $3,050,000 | $0 | $66,121,000 |
| Avg. | $2,852,381 | $5,828,810 | $35,855,476 |
Teacher salaries
Teacher salaries are categorized based on years of service. The 2014-2015 pay scale states that starting teachers in the district earn $39,000 and after 20 years in the district earn $50,400. They receive an additional $500 for a master's degree or doctorate. All local salaries are based on 187 working days.[9]
Schools in Eagle Pass Independent School District
Enrollment
Eagle Pass Independent School District served 15,094 students during the 2012-2013 school year. Eagle Pass Independent School District does not publicly archive enrollment data.[1]
District schools
Eagle Pass Independent School District operates 23 schools, which are listed below in alphabetical order:[10]
| Eagle Pass Independent School District | ||
|---|---|---|
| School Name | ||
| Armando Cerna Elementary School | ||
| Benavides Elementary School | ||
| CCWinn High School | ||
| Eagle Pass High School | ||
| Eagle Pass Junior High School | ||
| Early Childhood Center | ||
| Glass Elementary School | ||
| Graves Elementary School | ||
| Henry B. Gonzalez Elementary School | ||
| Kennedy Hall | ||
| Kirchner Elementary School | ||
| Language Development Center | ||
| Liberty Elementary School | ||
| Memorial Junior High School School | ||
| Perfecto Mancha Elementary School | ||
| Pete Gallego Elementary School | ||
| Ray H. Darr Elementary School | ||
| Robert E. Lee Elementary School | ||
| Rosita Valley Elementary School | ||
| Rosita Valley Literacy Academy | ||
| Sam Houston Elementary School | ||
| San Luis Elementary School | ||
| Seco Mines Elementary School | ||
Academic performance
The Texas Education Agency issues an annual accountability report for each school district in the state. This rating determines if district schools fulfill expectations in four categories of educational achievement during a particular school year. The following terms explain these categories:
- Student Achievement: Measures student performance on the annual Texas Assessment of Knowledge and Skills (TAKS) test.
- Student Progress: Measures student performance in reading, math and writing courses at the district level.
- Closing Performance Gaps: Measures year-to-year performance among students in the lowest-performing demographics.
- Postsecondary Readiness: Measures student readiness for college, employment or military service after graduation.
Eagle Pass Independent School District received a Met Standard designation on the state's 2013 report. District schools met 87 percent of indicators set forth by state education officials and all four assessment categories. The following table details the district's accountability report during the 2012-2013 school year:[11]
| Performance Index Summary, 2012-2013 | ||||
|---|---|---|---|---|
| Category | Points earned | Maximum points | Index score | Target score |
| Student Achievement | 23,971 | 31,074 | 77 | 50 |
| Student Progress | 827 | 2,400 | 34 | 21 |
| Closing Performance Gaps | 1,149 | 1,500 | 77 | 50 |
| Postsecondary Readiness | 505.6 | 600 | 84 | 75 |
Contact information
![]()
Eagle Pass Independent School District
1420 Eidson Rd.
Eagle Pass, TX 78852
Phone: (830) 773-5181
See also
| Texas | School Board Elections | News and Analysis |
|---|---|---|
 |
 | |
|
Eagle Pass Independent School District |
External links
- Eagle Pass Independent School District
- Maverick County, Texas
- Maverick County Clerk
- Texas Education Agency
- Texas Secretary of State
- Texas Ethics Commission
Footnotes
- ↑ 1.0 1.1 National Center for Education Statistics, "ELSI Table Generator," accessed June 17, 2014
- ↑ 2.0 2.1 2.2 United States Census Bureau, "Maverick County, Texas," accessed July 31, 2014
- ↑ Texas Secretary of State, "Maverick County," accessed December 31, 2014
- ↑ Eagle Pass Independent School District, "Superintendent," accessed June 5, 2015
- ↑ Eagle Pass Independent School District, "Board Policy Manual," accessed June 5, 2015
- ↑ Note: This text is quoted verbatim from the original source. Any inconsistencies are attributable to the original source.
- ↑ Eagle Pass Independent School District, "Board Policy — Public Participation," accessed June 5, 2015
- ↑ United States Census Bureau, "Public School System Finances: Historical Data," accessed December 1, 2015
- ↑ Eagle Pass Independent School District, "Professional Hiring Schedule 2014-2015," accessed June 5, 2015
- ↑ Eagle Pass Independent School District, "Schools," accessed June 5, 2015
- ↑ Texas Education Agency, "Accountability Summary 2013," accessed June 5, 2015
| |||||
 |
State of Texas Austin (capital) |
|---|---|
| Elections |
What's on my ballot? | Elections in 2026 | How to vote | How to run for office | Ballot measures |
| Government |
Who represents me? | U.S. President | U.S. Congress | Federal courts | State executives | State legislature | State and local courts | Counties | Cities | School districts | Public policy |
