Ballotpedia's battleground poll, 2016
Date: November 8, 2016 |
Winner: Donald Trump (R) Hillary Clinton (D) • Jill Stein (G) • Gary Johnson (L) • Vice presidential candidates |
Important dates • Nominating process • Ballotpedia's 2016 Battleground Poll • Polls • Debates • Presidential election by state • Ratings and scorecards |
2028 • 2024 • 2020 • 2016 Have you subscribed yet?
Join the hundreds of thousands of readers trusting Ballotpedia to keep them up to date with the latest political news. Sign up for the Daily Brew.
|
This page was current as of the 2016 election.
June 29, 2016
Polling was a hot topic in the 2016 election cycle. While the latest nationwide polls was clear on Clinton's large lead over Trump, Ballotpedia sought to find if this held true in the battleground states. If so, how would that lead have changed with either a high-ranking federal legislative figure or a well-known governor at the top of the Republican ticket?
Ballotpedia partnered with Evolving Strategies and surveyed voters across seven states (June 10 – 22) regarding their vote preferences. We tested six election scenarios. In one set, we matched Hillary Clinton (D) in a series of two-way contests with Donald Trump (R), Ohio Governor John Kasich (R), and House Speaker Paul Ryan (R). In the second set, we matched these same candidates in a series of three-way contests that also included former governor Gary Johnson.
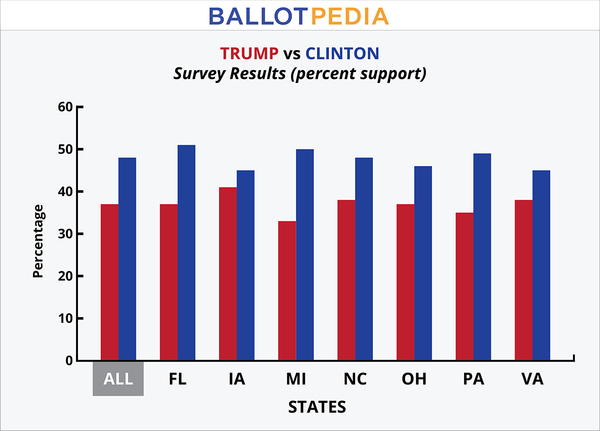
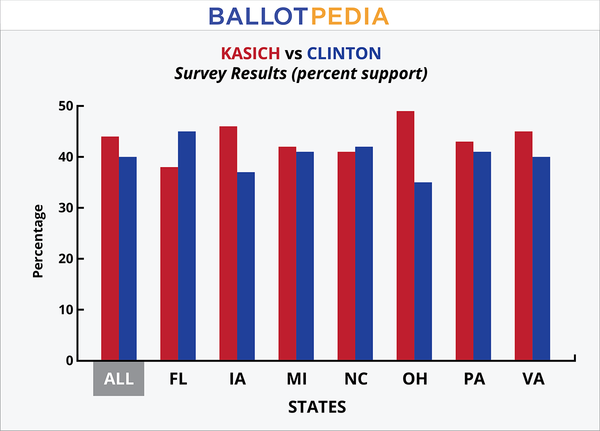
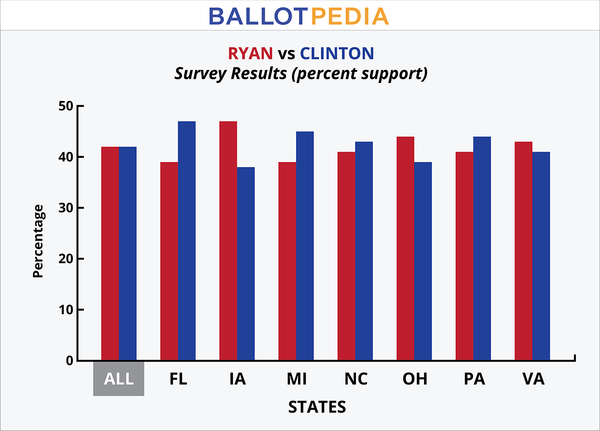
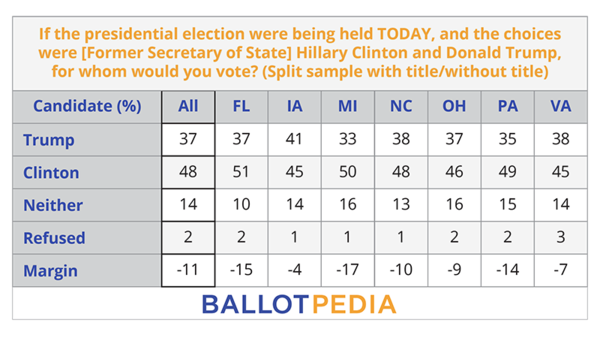
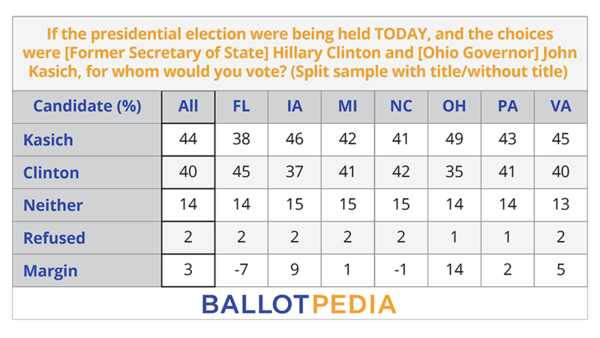
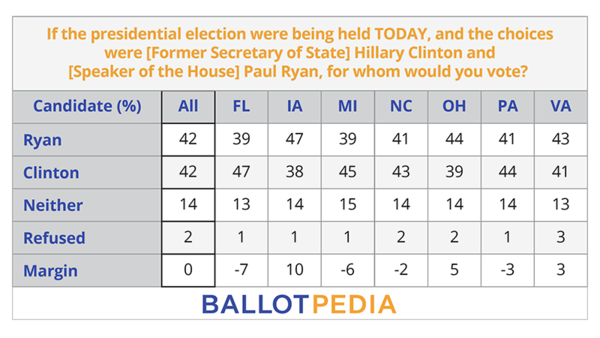
In all seven states, Clinton polled higher than Trump. The tightest battleground race between the two frontrunners was in Iowa, where Clinton led Trump by a weighted 4 percentage points. Clinton saw the largest lead in Michigan, where she led Trump by a weighted 17 percentage points. Comparatively, John Kasich polled ahead of Clinton in five of the seven states, and Paul Ryan polled ahead of Clinton in three states.

Evolving Strategies and Ballotpedia surveyed 4,242 registered voters, with a margin of error of +/-4.0%.
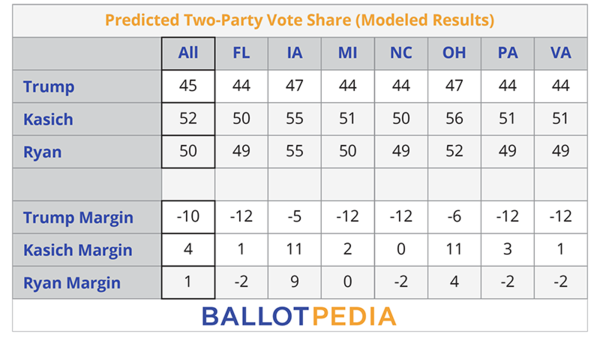
In addition to the weighted survey results, we conducted predictive modeling. The modeled results were predicted for the full voter file sample from each state with a machine-learning algorithm using the voter-file matched sample and a wide range of political and demographic variables, then weighted to expected turnout probability in a presidential election. These results demonstrated that Donald Trump would underperform Hillary Clinton by an average of 10 percentage points, versus John Kasich outperforming Clinton by 4 points and Paul Ryan outperforming her by 1 point. Using this model, Kasich would be predicted to win six of the seven states and would be even with Clinton in just North Carolina.
If you would like to explore the data Evolving Strategies compiled on the two-party vote share in the seven states, 2-party vote share in the various states click here.
Head-to-head matchups
Trump vs. Clinton
Kasich vs. Clinton
Ryan vs. Clinton
State-by-state highlights
Florida
- See also: Presidential election in Florida, 2016
Florida was one of only two states (the other being North Carolina) where all three Republicans polled worse than Hillary Clinton. Similarly, Clinton’s polling was the highest in Florida in each matchup.
Iowa
- See also: Presidential election in Iowa, 2016
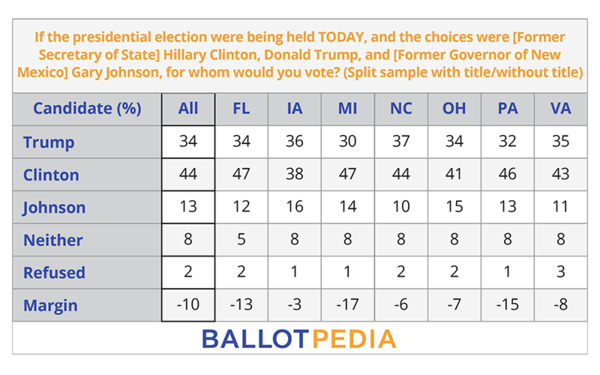
In Iowa, the Libertarian Party nominee, Gary Johnson, saw his highest polling against Donald Trump and Hillary Clinton. Johnson polled at 16 percent compared to Clinton’s 38 percent and Trump’s 36 percent.
Michigan
- See also: Presidential election in Michigan, 2016
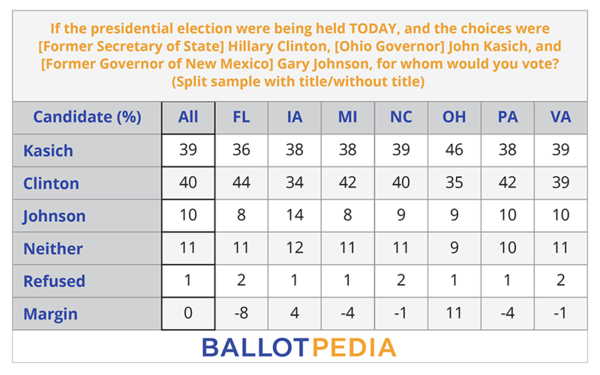
An alternate candidate to Donald Trump overcame the largest Clinton-Trump margin in Michigan. When compared head-to-head, Hillary Clinton defeated Trump by 17 points. However, in a one-on-one matchup, Kasich defeated Clinton by 1 point in polling. This was the largest margin where Clinton was ahead against Trump but trailed Kasich or Ryan.
North Carolina
Despite Mitt Romney, the Republican nominee, carrying North Carolina by a slim margin in 2012 (2.2 percentage points), Hillary Clinton led all three Republicans polled. However, in the predicted modeled head-to-head results, John Kasich was statistically even with Clinton, while Paul Ryan trailed her by 2 percentage points and Donald Trump was 10 full percentage points behind.
Ohio
- See also: Presidential election in Ohio, 2016
The spread between Donald Trump and Hillary Clinton as compared to John Kasich and Clinton was highest in Ohio. Trump polled at 37 percent compared to Clinton’s 46 percent. The figures were considerably reversed in a Kasich versus Clinton scenario. Kasich polled 49 percent to Clinton’s 35 percent.
Pennsylvania
Although John Kasich won only 19.4 percent of the Pennsylvania Republican primary vote on April 26, 2016, he was the only Republican in the study who polled above Hillary Clinton in the general election.
Virginia
- See also: Presidential election in Virginia, 2016
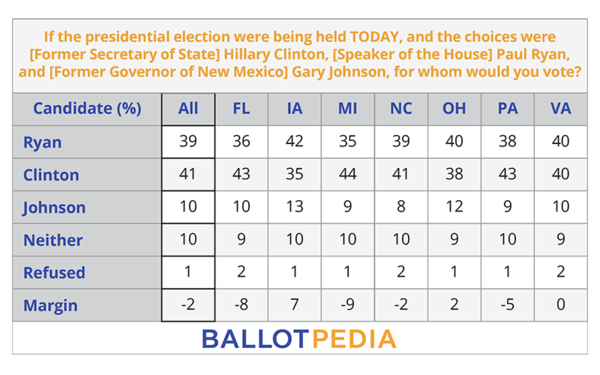
While the survey results showed Paul Ryan polling ahead of Hillary Clinton by a small margin (2 percentage points), the modeled survey had Ryan trailing Clinton by 2 points. While the race would have been tight for both Ryan and John Kasich (who polled 5 percentage points ahead of Clinton), Donald Trump was 12 percentage points behind Clinton in the predictive model.
Methodology
The samples in each state were drawn from a list of all active registered voters. All respondents are confirmed as registered voters in their states. From June 10 – 22, live interviewers called land lines and cell phones across seven states to survey:
- 596 Florida voters with a margin of error of +/- 4.0 percentage points;
- 601 Iowa voters with a margin of error of +/- 4.0 percentage points;
- 612 Michigan voters with a margin of error of +/- 4.0 percentage points;
- 603 North Carolina voters with a margin of error of +/- 4.0 percentage points;
- 617 Ohio voters with a margin of error of +/- 3.9 percentage points;
- 601 Pennsylvania voters with a margin of error of +/- 4.0 percentage points.
- 612 Virginia voters with a margin of error of +/- 3.9 percentage points.
The results were weighted to approximate major demographic targets based on Census data for each state. The modeled results were predicted using the voter-file matched sample using a wide range of political and demographic variables and weighted for expected turnout probability in a presidential election.
Interviews were conducted by Opinion Access Corporation of Long Island City, New York. Since 1995, Opinion Access Corp. has been an industry leader in telephone opinion polling with an emphasis on political polling. Their facility utilizes more than 375 stations and uses 100% computer-assisted telephone interviewing (CATI).
Survey instruments and results
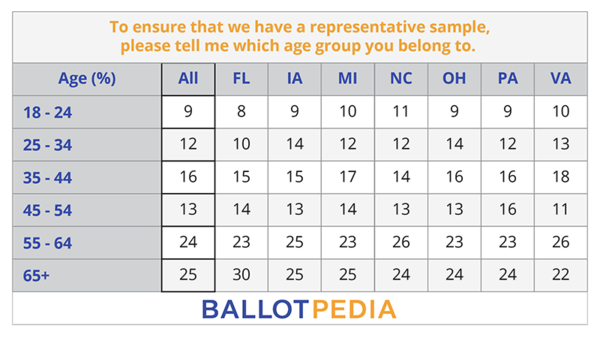
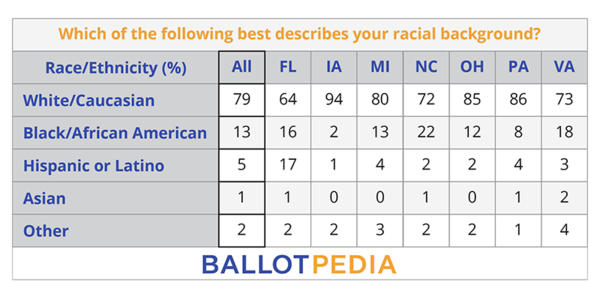
The tables below detail the full results of the poll. Respondents were asked 15 total questions.
1) To ensure that we have a representative sample, please tell me which age group you belong to.
2) Which of the following best describes your racial background?
3) Gender (RECORD BY OBSERVATION)
4) If the presidential election were being held TODAY, and the choices were [Former Secretary of State] Hillary Clinton and Donald Trump, for whom would you vote? (Split sample with title/without title)
5) If the presidential election were being held TODAY, and the choices were [Former Secretary of State] Hillary Clinton and [Ohio Governor] John Kasich, for whom would you vote? (Split sample with title/without title)
6) If the presidential election were being held TODAY, and the choices were [Former Secretary of State] Hillary Clinton and [Speaker of the House] Paul Ryan, for whom would you vote?
7) If the presidential election were being held TODAY, and the choices were [Former Secretary of State] Hillary Clinton, Donald Trump, and [Former Governor of New Mexico] Gary Johnson, for whom would you vote? (Split sample with title/without title)
8) If the presidential election were being held TODAY, and the choices were [Former Secretary of State] Hillary Clinton, [Ohio Governor] John Kasich, and [Former Governor of New Mexico] Gary Johnson, for whom would you vote? (Split sample with title/without title)
9) If the presidential election were being held TODAY, and the choices were [Former Secretary of State] Hillary Clinton, [Speaker of the House] Paul Ryan, and [Former Governor of New Mexico] Gary Johnson, for whom would you vote?
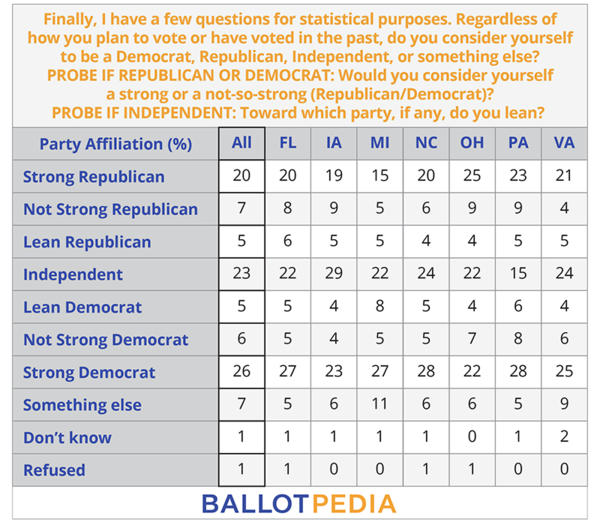
10) Finally, I have a few questions for statistical purposes. Regardless of how you plan to vote or have voted in the past, do you consider yourself to be a Democrat, Republican, Independent, or something else? PROBE IF REPUBLICAN OR DEMOCRAT: Would you consider yourself a strong or a not-so-strong (Republican/Democrat)? PROBE IF INDEPENDENT: Toward which party, if any, do you lean?
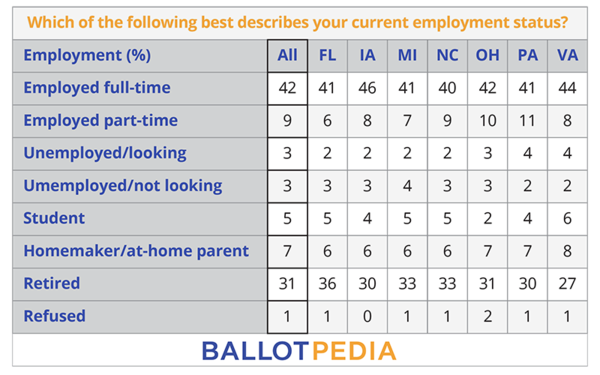
11) Which of the following best describes your current employment status?
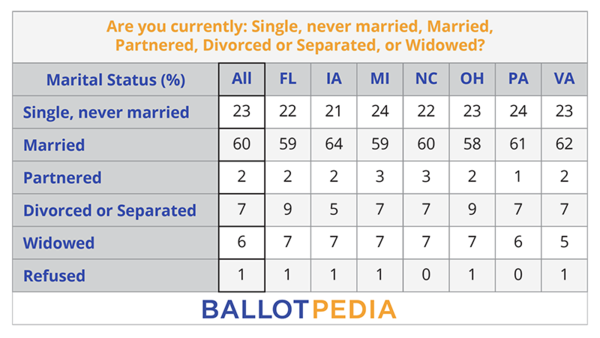
12) Are you currently: Single, never married, Married, Partnered, Divorced or Separated, or Widowed?
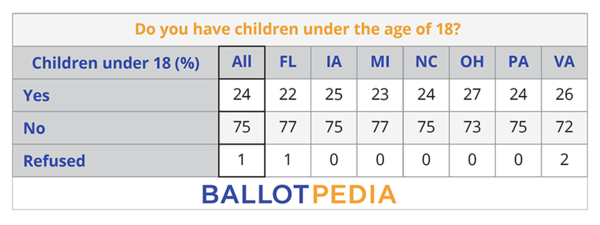
13) Do you have children under the age of 18?
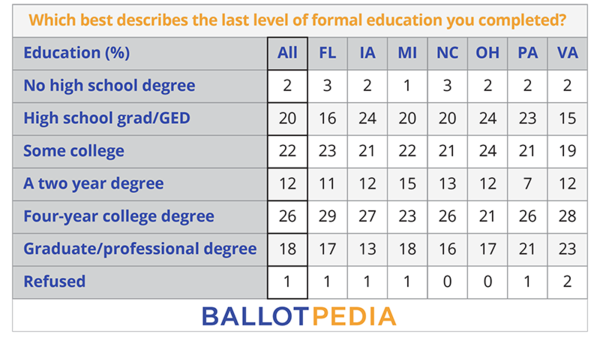
14) Which best describes the last level of formal education you completed?
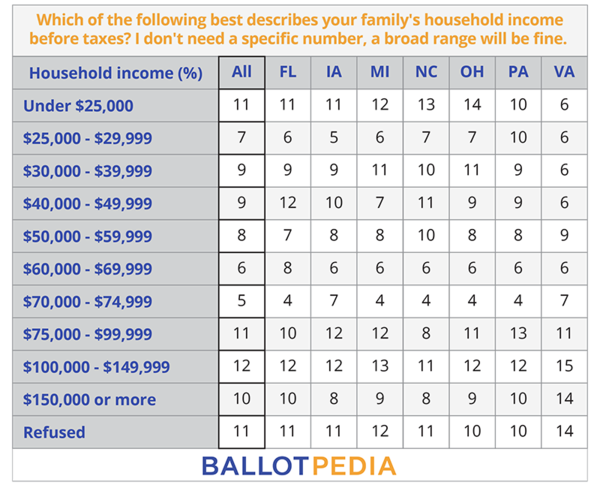
15) Which of the following best describes your family's household income before taxes? I don't need a specific number, a broad range will be fine.
Contact information
If you’d like more information, or to schedule an interview, please contact Ballotpedia’s Director of Communications, Kristen Mathews, at Kristen.Mathews@Ballotpedia.org
About Evolving Strategies
For this poll, Ballotpedia partnered with Evolving Strategies, a clinical data science firm. Evolving Strategies collects data through surveys (both telephone and online), executes randomized controlled trials, and uses machine learning to accurately predict opinion and how a message will move people.
ES has a team of academically trained researchers who are experts in survey development, data analysis, data visualization, and the development of web-based data apps.
See also
- Trump faces uphill climb in swing states
- Donald Trump presidential campaign, 2016
- Hillary Clinton presidential campaign, 2016
- John Kasich presidential campaign, 2016
- Paul Ryan
- Presidential election, 2016
- Presidential election, 2016/Polls
- Important dates in the 2016 presidential race


