Projected outcomes of state legislative elections, 2011
This page details Ballotpedia's projections of the results of the 2011 state legislative elections.
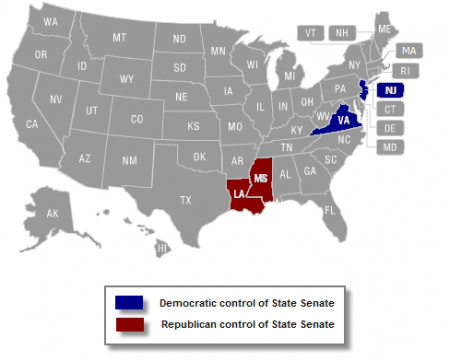
State senate election projections
| Democrats Before election: 19 Projected after election: 18 |
Toss-up 1[1] |
Republicans Before election: 29 Projected after election: 30 |
|---|
| 17 Safe or Not Up | 0 | 1 | 1[1] | 2 | 1 | 27 Safe or Not Up |
|---|
Since one state senate is nonpartisan, a political party is defined as having the majority of state senates if it has at least 25. |
|---|
| Safe D | Likely Dem. | Leans Dem. | Toss Up | Leans GOP | Likely GOP | Safe R |
|---|---|---|---|---|---|---|
| Not up: Arkansas (D) California (D) Colorado (D) Connecticut (D) Delaware (D) Hawaii (D) Iowa (D) Illinois (D) Maryland (D) Massachusetts (D) Nevada (D) New Mexico (D) Oregon (D) Rhode Island (D) Vermont (D) Washington (D) West Virginia (D) |
New Jersey (D) | Not up: Alaska (Split)[1] |
Possible R Pick-up: Virginia (D) Mississippi (R) |
Louisiana (R) |
Not up: Alabama (R) Arizona (R) Florida (R) Georgia (R) Idaho (R) Indiana (R) Kansas(R) Kentucky (R) Maine (R) Michigan: (R) Minnesota (R) Missouri (R) Montana (R) New Hampshire (R) New York (R) North Carolina (R) North Dakota (R) Ohio (R) Oklahoma (R) Pennsylvania (R) South Carolina (R) South Dakota: (R) Tennessee: (R) Texas (R) Utah (R) Wisconsin (R) Wyoming (R) |
|
|---|
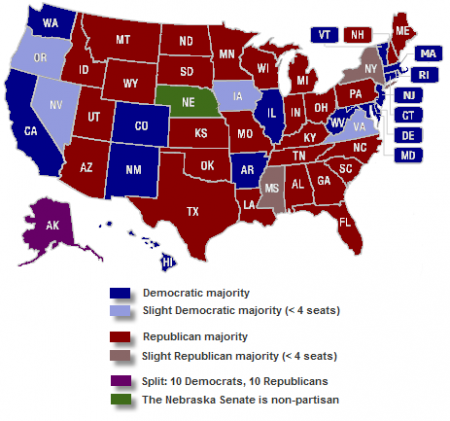
Map of current state senates
heading into the 2011 state legislative elections 
|
|---|
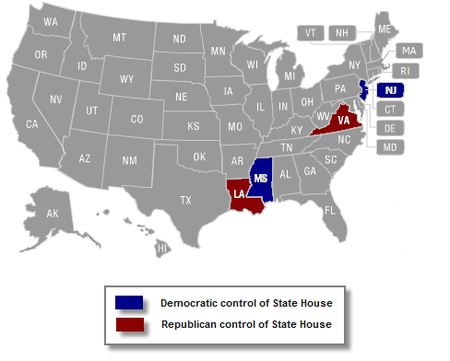
State house election projections
| Democrats Before election: 18 Projected after election: 17 |
Toss-up 0 |
Republicans Before election: 29 Projected after election: 30 |
|---|
| 16 Safe or Not Up | 0 | 1 | 0 | 1 | 2 | 27 Safe or Not Up |
|---|
Since there are 49 state houses (Nebraska only has a senate), a political party is defined as having the majority of state houses if it has at least 25.
|
|---|
| Safe D | Likely Dem. | Leans Dem. | Toss Up | Leans GOP | Likely GOP | Safe R |
|---|---|---|---|---|---|---|
| Not up: Arkansas (D) California (D) Connecticut (D) Hawaii (D) Maryland (D) Massachusetts (D) New York (D) Rhode Island (D) Vermont (D) West Virginia (D) Kentucky (D) Illinois (D) Nevada (D) New Mexico (D) Delaware (D) Washington (D) |
New Jersey (D) | Not up: Oregon (Split)[2] |
Possible R Pick-up: Mississippi (D) |
Louisiana (R) Virginia (R) Not up: Arizona (R) Florida (R) Georgia (R) Idaho (R) Kansas (R) Missouri (R) North Dakota (R) Oklahoma (R) South Carolina: (R) South Dakota: (R) Utah (R) Wyoming (R) Indiana (R) Montana (R)[3] Ohio (R) Pennsylvania (R) Wisconsin (R) Alaska: (R) Tennessee: (R) Texas (R) New Hampshire (R) North Carolina (R) Maine (R) Michigan (R) Minnesota (R) Alabama (R) Colorado (R) Iowa (R) |
|
|---|
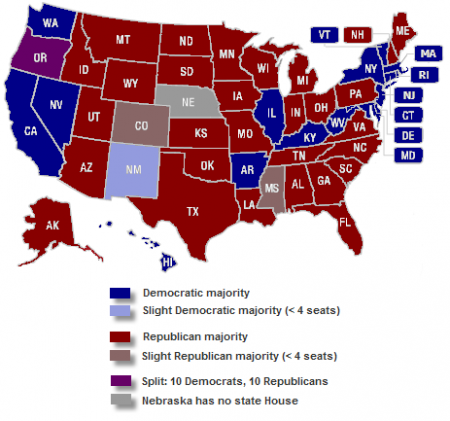
Map of current state houses
| Partisan dominance in state houses heading into the 2011 state legislative elections  |
|---|
See also


