Competitiveness in State Legislative Elections: 1972-2014
![]() This article may not adhere to Ballotpedia’s current neutrality policies.
This article may not adhere to Ballotpedia’s current neutrality policies.
By Carl Klarner
May 6, 2015 · Contact Ballotpedia
The 2014 election continued the decline in U.S. electoral competitiveness that has occurred in general elections since 1972. This report is the first examination of 2014 state legislative general election returns at the district level, better demonstrating the true impact of the decline in competitiveness.
The percentage of people living in uncontested state house districts was higher than any other year, while that percentage in state senate districts came close. |
These declining levels of competitiveness occurred despite 2014 being a 'wavelet' election, while such elections generally see an upswing.
Trends in electoral competitiveness are fundamental indicators of the health of our republic. Many believe that competitiveness keeps elected officials beholden to the people. If legislators can count on being re-elected, they have little incentive to do what voters want. There are also concerns that one-sided elections disengage the electorate. Parties and candidates do more to convince people and get them to the polls when races are closely fought, and as a result, the electorate becomes more informed, engaged and active. Conversely, not all would be troubled by the overall decline in competition that this report documents. Some argue that if more people are on the winning side, more people are satisfied with the result of an election. They may also voice skepticism that lack of competition will make elected officials less responsive.
The rate at which incumbents win re-election is another aspect of the democratic process over which many voice concern. Some believe that incumbents are able to use the advantages of office to insulate themselves from losing elections. If incumbents can do this, they then have little incentive to give the people the policies they want, and public policy remains unresponsive. This report also documents the high propensity for incumbents to win re-election, although there has been a marked decline in the percentage of races with incumbents.
As will be shown below, these trends have occurred not only at the state level, but also with national offices—the U.S. House, the U.S. Senate and the presidency. Declines in electoral competitiveness have been driven by the increased partisanship and polarization of the American electorate, and have been documented by numerous political scientists (see Abramowitz 2013, Jacobson 2015, Levendusky 2009).[1][2][3] As the electorate has polarized, people who agree with each other politically and share the same party have become more likely to live in the same geographic area—whether state legislative districts, congressional districts or entire states. The decline in competitiveness has been well documented for national offices, but not for state legislatures.
The remainder of this report examines the competitiveness of the 2014 state legislative elections in the context of how trends in competitiveness have developed since 1972 and in the context of trends in competitiveness for higher level offices. Click here for a state map with links to figures depicted on the main page of this report for each state.[4]
Competitiveness in the 2014 state legislative elections
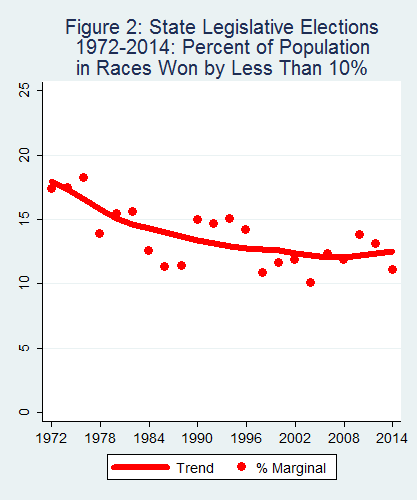
Traditionally, competitiveness has been measured by examining the percentage of elections won by "marginal" amounts—5 percent or less (5 percent marginality) or 10 percent or less (10 percent marginality). The main body of this report focuses on the 5 percent definition, but figures for the 10 percent definition are reported in the Appendix and show the same overall trends. Because state legislators represent districts of wildly varying population size, state legislative data were computed in the following manner. The number of people living in districts that had competitive elections was divided by the total number of people living in all districts with one or more elections. The resulting figure was then multiplied by 100 to make it a percentage. This is in contrast to presenting data as the percentage of all elections with a particular attribute.
The idea here is that the power and importance of two legislators are more similar to the relative number of people they represent than to equality of importance. An election to the California State Assembly with an average population of 483,000 is more consequential than an election to the New Hampshire House of Representatives with 3,313 residents per legislator. Interested readers can consult the Appendix for further details on how this report was conducted.
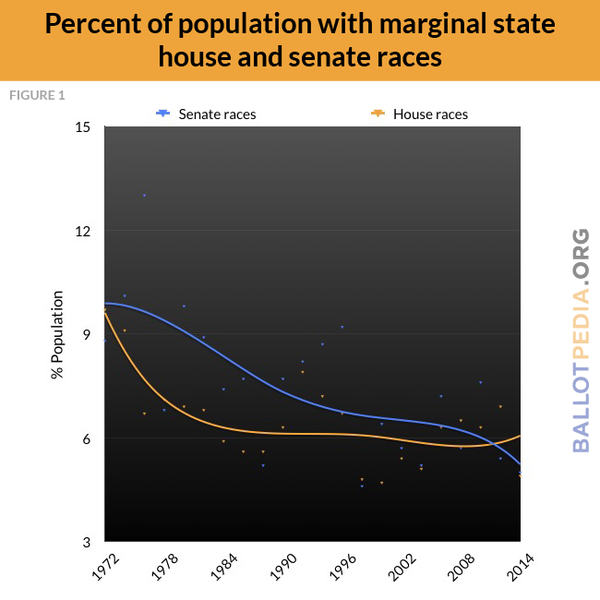
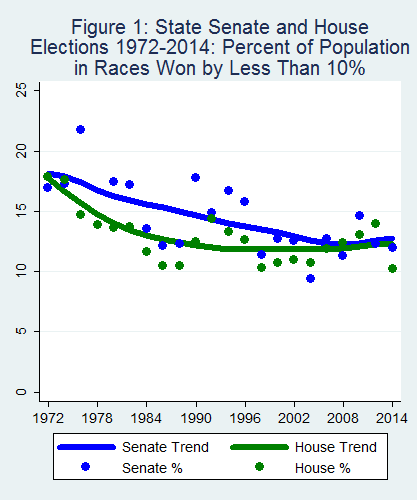
Line graphs have the danger of directing too much attention to year-to-year changes. Accordingly, figure 1 shows the percentage of people living in districts with state legislative elections won by 5 percent as a dot for each election year, and lines that fit the data the “closest” while being allowed to curve are added to give an impression of trends without reading too much into any single election.
Figure 1 indicates that the 2014 elections saw among the lowest levels of competitiveness in the last 40 years. The percentage of people living where a state legislative election was won by 5 percent or less was the second lowest for state senates since 1972. The 2014 state house elections saw the third lowest percent of races won by less than 5 percent over the period from 1972 to 2014. Only 4.9 percent of the country had state house elections in districts that were won by a 5 percent margin or less. As table 1 indicates, 2014 was only 0.2 percent from the lowest year (2000) and 4.8 percent from the highest (1972). State senates saw the second lowest level of competitiveness for races won by a 5 percent margin or less, with 5.0 percent of the country living in such districts. State senates had been more competitive than state houses in the past, although this difference has diminished if not disappeared. Figure 1 also indicates that state senate and state house competitiveness have roughly moved together, allowing a simplification of the discussion by looking at both chambers simultaneously.
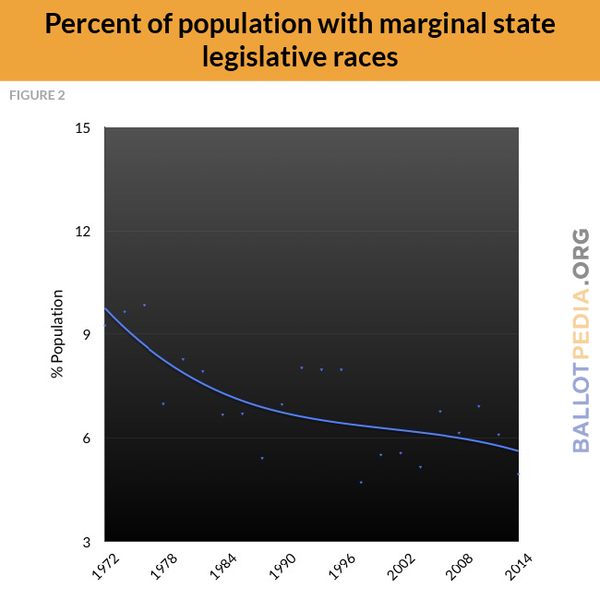
The data displayed in figure 2 represent marginal races over time for state legislatures as a whole, and are essentially averages of the data from the two chambers in figure 1.
For both state legislative chambers combined, only 4.9 percent of people lived in a district won by less than 5 percent. In other words, 95.1 percent of people lived in a district where the winner won by more than 5 percent. This was the second lowest year for the 22 elections in the 1972 to 2014 period, being only 0.2 percent from the lowest year, and 5 percent from the highest. Figure 2 indicates that competitiveness declined from 1972 at around 9 percent of the people living in districts being won by 5 percent or less to 6 percent in 2014. A decline of competitiveness has clearly occurred, and while it apparently bottomed out in the late 1990s, there is no sign it will let up.
The role of the South
The role of the “solid South” in these trends is important to take into account. Up until the 1960s, despite being one of the most conservative parts of the country, the Southern United States was dominated by the Democratic Party. For example, the 1960 elections saw 10 out of 22 Southern legislative chambers with 100 percent of their legislators—not 95 percent, not 99 percent, but 100 percent—Democratic. Thus, this was a very uncompetitive region. But soon after 1960, the South went through a “mini-realignment” in which partisan divisions and party labels became more like the rest of the country: As a result, the South became more Republican.
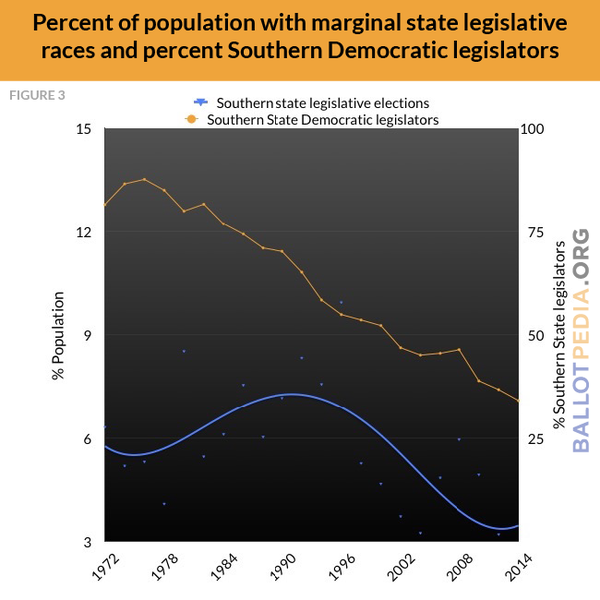
Figure 3 depicts trends in competitiveness in the 11 states of the confederacy since 1972. The yellow line ("Southern Democratic legislators") in figure 3 shows the steady progress of Southern Democrats, while the blue line ("Southern state legislative elections") denotes the percentage of people in the South living in districts won by less than 5 percent. The figure indicates that as the Democrats lost ground, competitiveness increased, and when the Southern parties were becoming evenly matched, competitiveness was greatest. Once the South moved through this transition period, it was even less competitive than it was in the 1970s. The 2014 elections saw by far the lowest levels of competitiveness in the South.
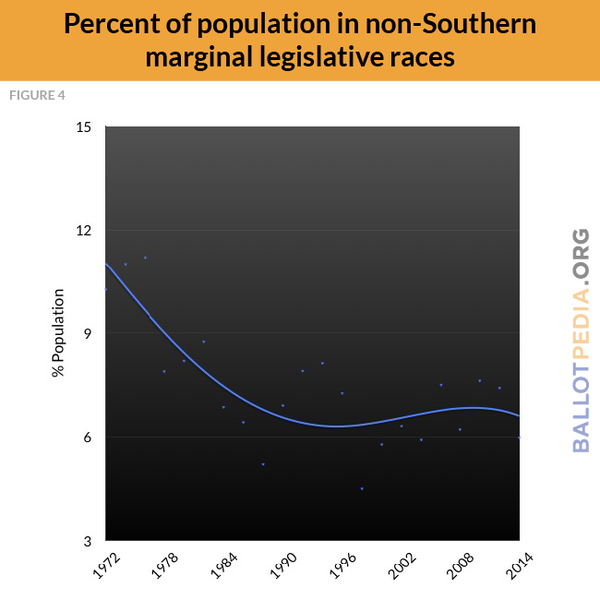
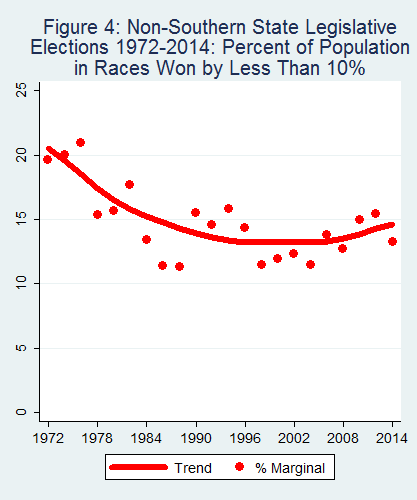
Figure 4 shows the competitiveness of non-Southern states. Comparing figure 3 with figure 4 indicates that the South is much less competitive than elsewhere. The 2014 elections saw the South bottom out not only in an absolute sense, but also relative to the non-South. The percentage of people living in districts won by less than 5 percent was around two-fifths of what it was in the rest of the country.
Taking into account the “bump” in close races caused by the Southern mini-realignment gives us more insight into what is going on nationally regarding competitiveness. Figure 4 indicates a steeper decline in competitive elections than figure 2, punctuated by a spike in 1992-1996, then another abrupt decline, and what appears to be a gradual increase up to the present.
Wave elections
But what looks like a gradual increase is caused by slight upticks in the elections of 2006, 2010 and 2012. Wave elections, like 1974 or 1994, generally see more competitiveness, which explains 2010, as the Republicans swept state legislatures. The Democrats also picked up a fair number of chambers in 2006, perhaps explaining the increase that year. It is also plausible that years ending in “2” generally have higher levels of competitiveness than the years immediately following, because of redistricting and the resulting shakeup, which would account for the slight rise in 2012.
One would expect these two factors—the 2014 wavelet and redistricting—to have driven competitiveness up in 2014, which makes the 2014 elections seem especially placid. Since 1972, only 1974, 1978, 1994 and 2010 elections saw one party pick up more chambers than the Republicans did in 2014. Additionally, just over half of state senate seats in 2014 had been redistricted since the last time they were up.
The next three election cycles promise to be extremely uncompetitive, with perhaps a slight punctuation caused by a wave or wavelet.
The map in this section displays the percentage of each state’s population in the last four years (2011 to 2014) living in districts that were won by 5 percent or less for both the state senate and state house elections. Three clusters of states that are high in competitiveness are apparent. California and Nevada form the first cluster. The second cluster is in the center of the country, including Montana, North Dakota, Colorado, New Mexico, Kansas, Nebraska, Iowa, Minnesota, Wisconsin and, strangely enough, Arkansas. The third cluster is in the Northeast, and includes Maine, New Hampshire, Vermont and Connecticut. West Virginia stands on its own. Five out of 11 former confederate states were low in competitiveness, with the remainder having medium levels, excepting Arkansas as already noted. The “border states” of Oklahoma and Kentucky were low and connected to this cluster. The middle Atlantic region is mostly moderate in competitiveness, while Pennsylvania, Ohio and Illinois formed a stretch of low states, with Indiana and Michigan having medium levels of competitiveness. The Northwest and four mountain states form a cluster of low-medium states.
Marginal 5%
The role of primary elections in competitiveness
Some contend that uncompetitive general elections are not a concern because primaries provide the competition they lack (Brunell 2008).[5] If a district is too one-sided, its partisans can “duke it out” in the primary. However, the 2014 state legislative primaries were not very competitive either, continuing an existing trend. Only 5.2 percent of people lived in a district where at least one of its party’s state legislative primaries was won by 5 percent or less, which is roughly similar to the level of competitiveness in general elections.
It should be noted that the charitable assumption was made above that a district has a competitive primary if either party’s primary is competitive. This is especially charitable because there was an almost perfect negative relationship between how competitive a district’s Democratic and Republican primaries were in 2014. That means that if the Democrats held a primary where the winner won by less than 5 percent, the Republican primary in that district was almost always uncompetitive, and vice versa. For primaries marginal at the 5 percent level, all districts having elections that were not in top-two primary states (California, Nebraska and Washington, which account for 27.1 percent of the population of the state legislative districts that were up) saw only 2.1 percent of their populations living in districts with marginal Democratic primaries, and only 3.2 percent lived where there was a marginal Republican primary. Of people living in top-two primary states, 5.2 percent lived where there was a 5 percent marginal primary.
What percentage of people lived in a district that was either competitive in the general election, competitive in the Democratic primary or competitive in the Republican primary? Only 9.9 percent of the time was one of the party’s primaries or the general election won by less than 5 percent. This is a low enough level of competitiveness overall, but additionally, it’s usually the case that only one of these conditions—a competitive primary or a competitive general election—is true at any one time. If a general election is competitive utilizing the 5 percent definition of competitiveness, one or more of the primaries in the district are rarely so (11 times out of 306 times), and if at least one of the primaries is competitive, the general election is unlikely to be (11 times out of 181 times).
One in 10 elections being competitive is a poor showing no matter what, but the notion that our elections are really competitive because of primaries is not convincing because primary turnout is extremely low. In 2014, about 107 million people voted in the state legislative general elections, while about 27 million voted in state legislative primaries. Demanding that citizens show up to vote in primaries in order to have a “choice” in elections is onerous, and most choose not to do so.
Uncontested elections
Many also voice concern over elections that are uncontested. Such elections have only one candidate, so the winner is known with certainty in advance. Voters in such elections have no alternatives, and incumbents may have less of a reason to be responsive. That being said, trends in such elections tell us less about the health of the republic than if elections were closely won. This is because such elections are often in locales that are so one-sided for one party or the other that they would have been forgone conclusions had they been contested.
Figure 5 reports the percentage of people living in state senate and state house districts with uncontested races. There has been an upward trend in uncontested elections over time, especially for state houses, consistent with the decline in marginal races. In 2014, 32.8 percent of people living in states with senate elections had no readily available choice about who to vote for, while 40.4 percent of those living in states with house elections similarly had no readily available choice. The 2014 state senate elections were the fifth highest in uncontested elections from 1972 to the present; they were only 4 percent from the highest election, but 11 percent from the lowest. The 2014 state house elections saw a higher percentage of uncontested elections than any other election in the period, by 3 percent.
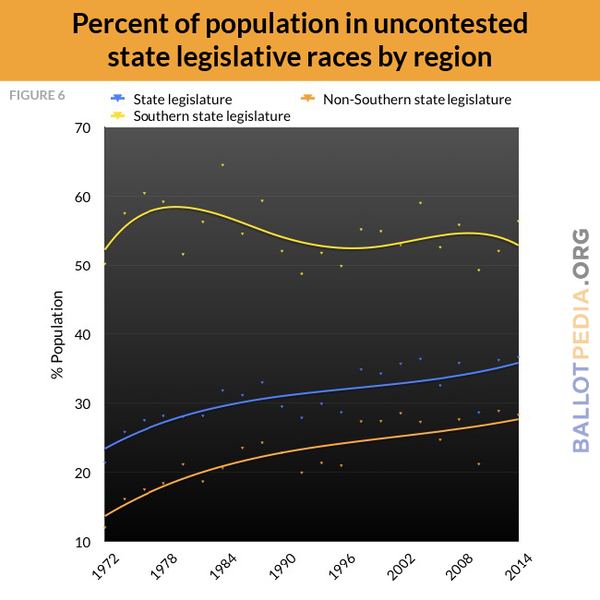
Figure 6 examines the extent to which both chambers combined are uncontested, for the South, the non-South and the country as a whole. The blue dots denote the percentage of Americans in districts with uncontested elections, and 2014 saw the highest level in the 1972 to 2014 period, with 36.7 percent of people living in districts with uncontested state legislative elections. The blue trend line for the country as a whole indicates that about 25 percent of Americans lived in districts with uncontested elections in the early 1970s, while today over 35 percent do. The yellow line in figure 6 tracks uncontested races in Southern states. Southern states have much higher rates of uncontested races than elsewhere, although this level has actually fallen somewhat in that region. Examining only the non-Southern states, depicted by the orange line, makes the rise of uncontested elections appear even more extreme. Both figure 5 and figure 6 indicate that 2010 was a low year for uncontested elections, consistent with the idea that wave years see more competitiveness. Figure 6 indicates that uncontested elections have edged up since that time.
State legislative primaries also show much lower levels of competition compared to general elections. Almost 39 percent of people lived in districts that were contested for at least one party’s primary, meaning 61 percent did not have access to a contested primary for either party. 11.7 percent of the country lived in districts with a contested Democratic primary, 15.9 percent in districts with a contested Republican primary, and 13.2 percent in a contested top-two primary.
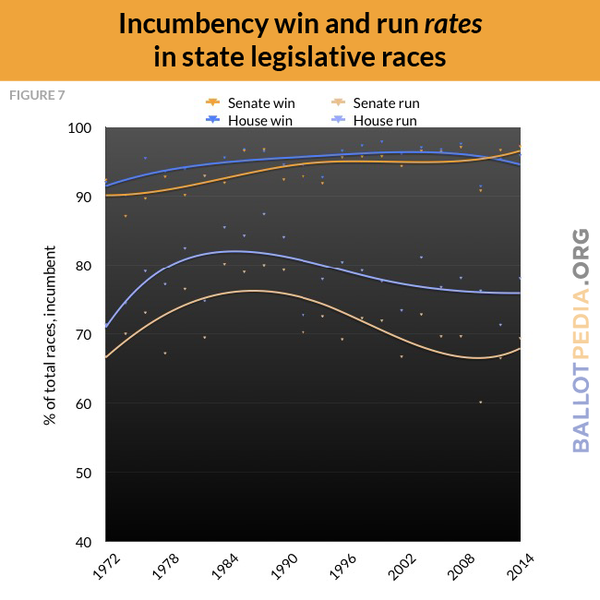
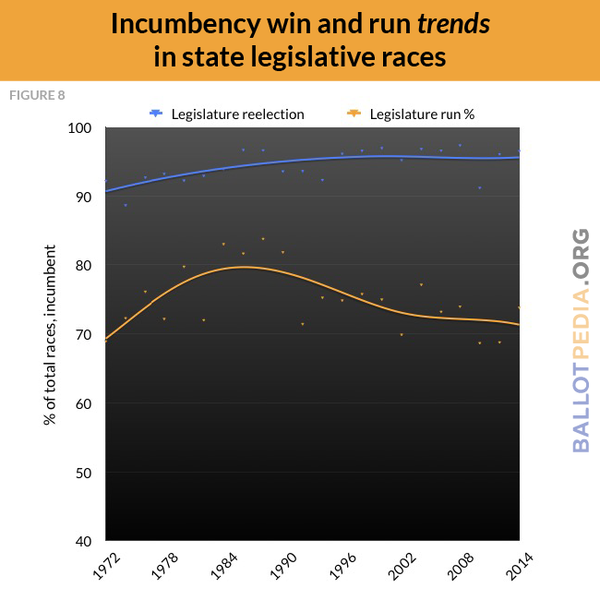
Figure 7 and figure 8 show trends in incumbent re-election rates over time, as well as the rate at which incumbents run over time. Figure 7 shows this for both state legislative chambers while figure 8 combines them. The incumbency win rate has never been less than 90 percent since 1972, with the exception of 1974 when the Democrats swept the nation after the Watergate scandal and “only” 88 percent of incumbents won re-election. More importantly, incumbency win rates have generally trended up over time, although 2010 saw a sharp decline before returning to almost where it was before. In 2014, 96.5 percent of the nation saw incumbents who were running for re-election win. This level was a mere 0.8 percent lower than in 2008, incumbents’ most successful year, but 6.8 percent higher than in 1974, the lowest year in the period.
The percentage of races with incumbents in them trended up until the late 1980s, and then came down after 1990. Much of the decline in incumbents seeking re-election is explained by the implementation of term limits, which kicked in with the 1996 election.
Surprisingly, the improvement in the fortunes of incumbents is not because incumbents have more advantages over challengers than before. It is because incumbents are more likely to come from districts that are safe for their party than in the past. In analyses not shown here, it is estimated that the boost from incumbency was at a high point of about 8 percent in 1990, but has steadily dropped to about 5 percent with the 2014 state legislative elections.
Trends in competitiveness for other offices
The decline in competitiveness has not been restricted to state legislative elections. Other work has already documented these changes for other offices, but these trends are shown to give context.
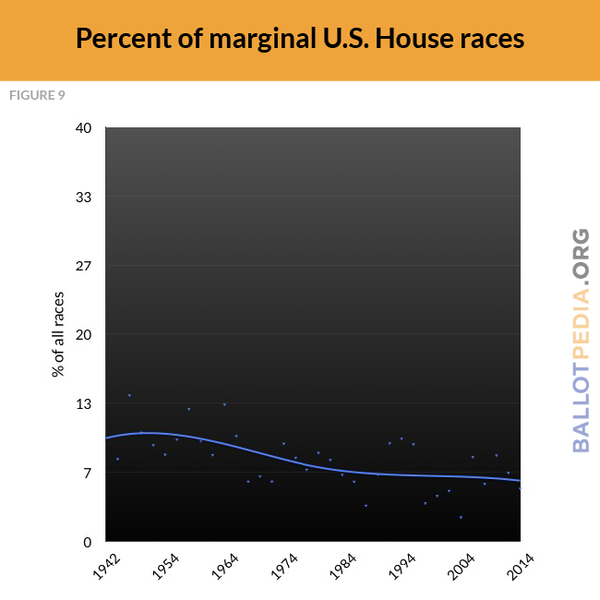
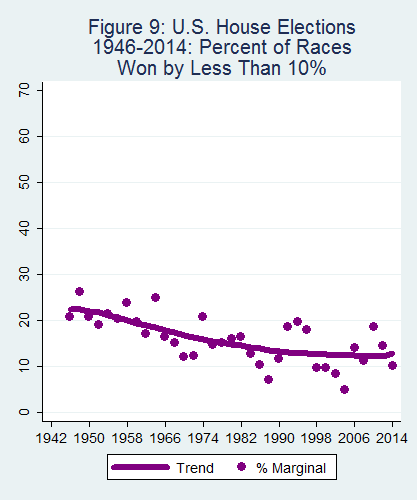
Figure 9 displays changes in the percentage of U.S. House elections won by 5 percent over time. The trend lines show a decline from about 10 percent of elections being won by 5 percent or less at the end of WWII to about 6 percent today. The declines in the 1960s were famously noted by political scientists and were explained by the growing power of incumbency. However, the estimated electoral boost from incumbency in U.S. House elections has declined similarly to the downward trend in state legislative elections. Competitiveness is in decline for U.S. House elections because districts themselves are safer for one party or the other.
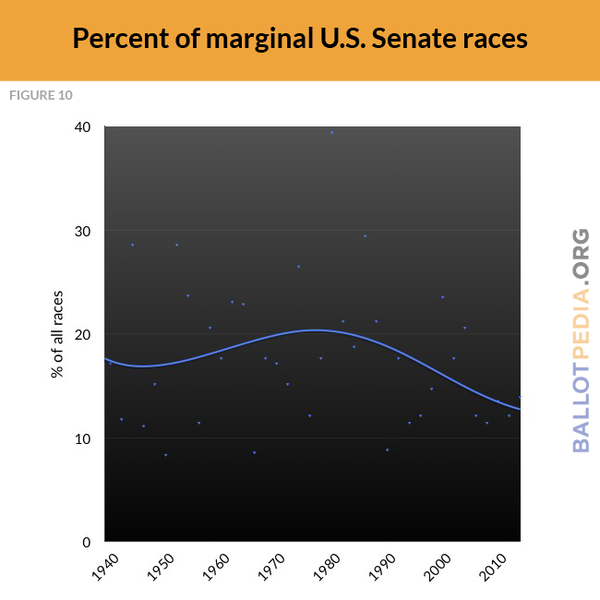
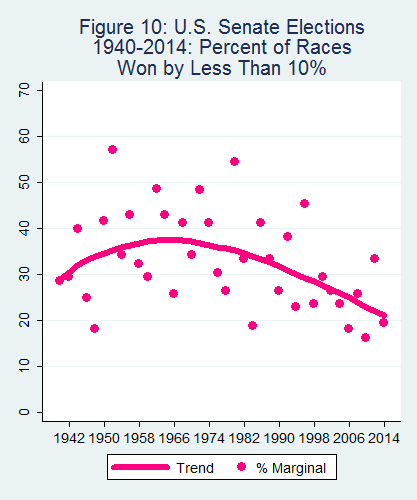
Figure 10 displays the percentage of marginal U.S. Senate elections over time. The U.S. Senate is far more competitive than the U.S. House. The decline in competitiveness is more marked than in the House, but the trend is different, as each state has equal weight. The temporary increase in competitiveness in the 1964 to 1990 period was caused by Southern states briefly becoming more competitive. As with state legislative elections, if you remove Southern states from the analysis of both the U.S. House and the U.S. Senate, the decline in competitiveness becomes much steeper, especially for the U.S. Senate. Some argue that the decline in competitiveness is related to gerrymandering. The steep decline in competitiveness in the U.S. Senate casts doubt on that explanation.
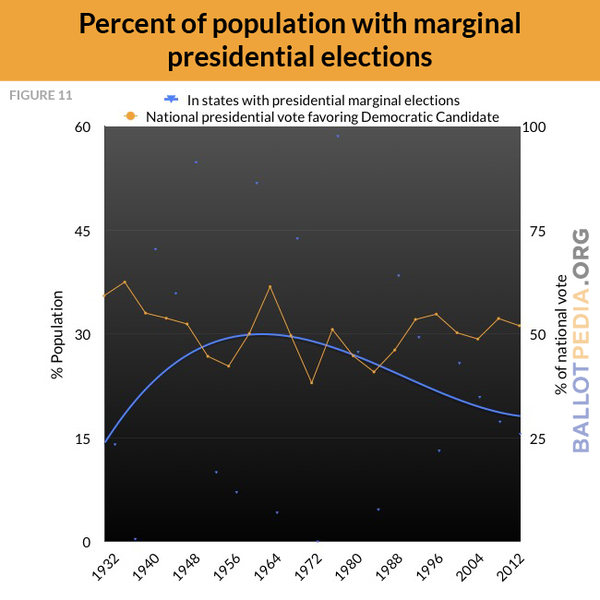
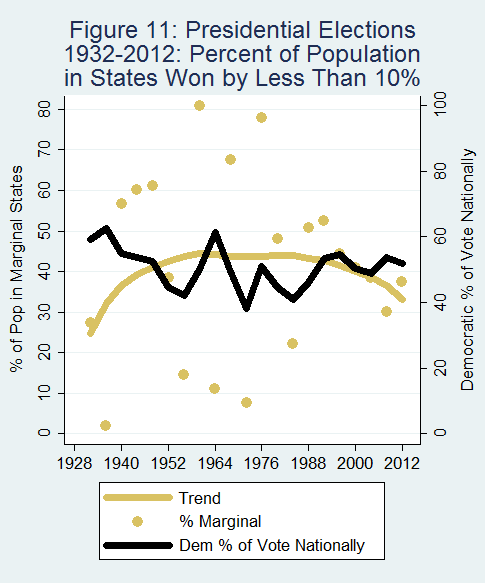
What has happened to the competitiveness of presidential elections is more complex, but ultimately the outcome has been the same. Figure 11 shows the percentage of people living in states that were won by 5 percent or less, represented by the blue line. Such states are not exactly the same as “swing states,” but the concepts are similar. The figure shows a clear decline in the percentage of people living in marginal states compared to the 1988 election. Before that, the percentage of people living in marginal states widely fluctuated, and was often very high or very low, making it harder to determine a trend.
To help understand what has happened to the trend over time, the yellow line in the figure shows the percentage of the vote going to the Democratic presidential candidate in the nation as a whole. This shows that landslide elections are associated with very few marginal states. For example, Johnson won by more than 60 percent of the vote in 1964, and the percentage of the country living in states won by 5 percent or less was about 4 percent. Nixon’s landslide in 1972 was so thorough that no state was won by 5 percent or less. Reagan’s victory in 1984 was similar. Unsurprisingly, there is a relationship between how many states are closely won and how closely won the election is nationally.
It is telling to compare elections that were very competitive nationally with the percentage of the country living in marginal states, in both the pre- and post-1984 periods. Closely fought elections in the early period, such as 1948, 1960, 1968 and 1976, display very large percentages of the country living in narrowly won states. In contrast, the close elections of 2000, 2004 and 2012 saw many fewer people in marginal states than those earlier close elections. Offsetting this tendency is the fact that after 1984, there have been no landslide elections. The tendency for presidential elections to be close at the national level will probably continue into the near future. Fewer people are apt to switch their votes than in the past, so the percentage of the vote going to the Democratic candidate will appear within a narrower range. While 1984 was won by 18 percent of the popular vote nationally, no election since that time has been won by more than 10 percent. But overall, there has been a decline in the percentage of people living in “swing states” since that time, which is reflected in the downward trajectory of the blue line.
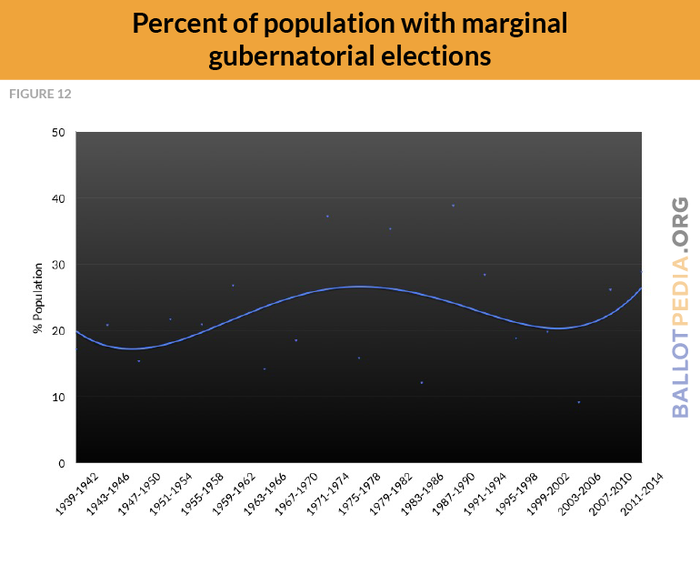
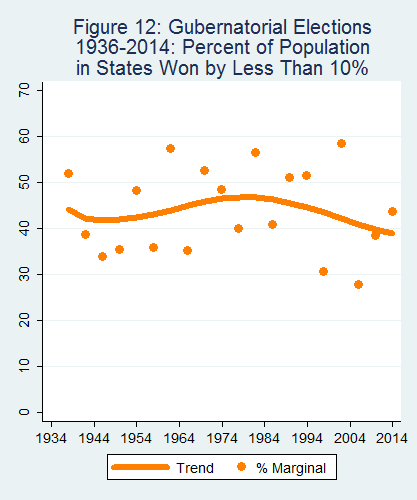
Figure 12, which tracks the percentage of people living in states with marginal gubernatorial elections over time, indicates that gubernatorial elections are more competitive on average than even U.S. Senate elections. Because about three times more gubernatorial elections are held in midterm than presidential election years, data are reported in four-year periods, and also include odd-year gubernatorial elections (i.e., 2011-2014). For the 5 percent definition of marginality, gubernatorial elections appeared to become more competitive between the 1930s and mid-1980s, at which point competitiveness declined.
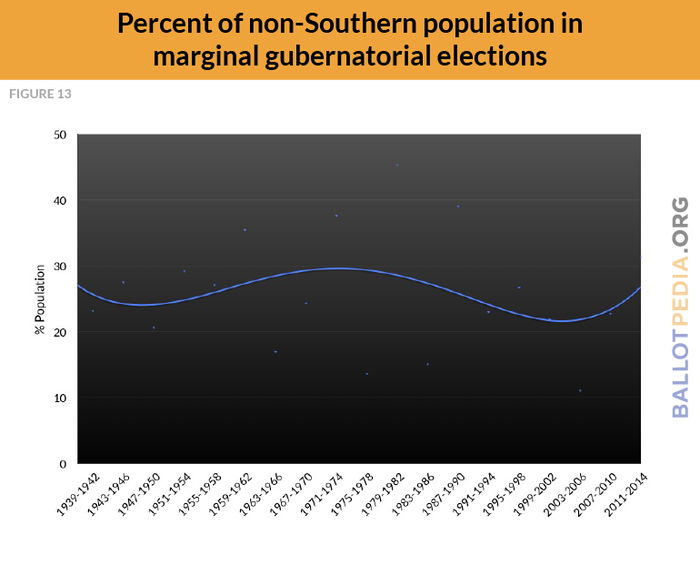
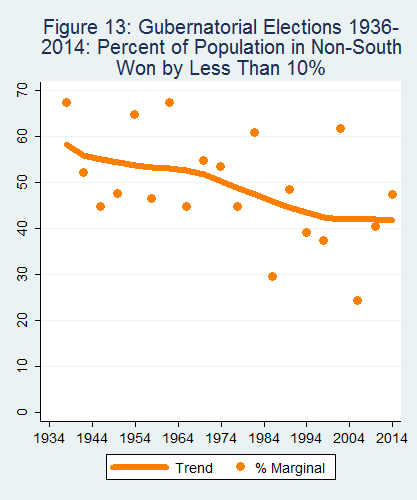
Figure 13, which only examines the non-Southern states, indicates a small decline in marginal races. Overall, the percentage of the population living in states with elections won by 5 percent or less of the vote appears to have dropped about 5 percent from 1935-1938 to 2011-2014.
Conclusion
The American electorate has become increasingly polarized and partisan. People who identify with the same political party are more likely to live in the same geographic locale than they were in the past. These changes have had many consequences for American politics, but one has been to drive down electoral competitiveness.
The figures above indicate that competitiveness is declining. The percentage of 2014 state legislative elections won by 5 percent or less was nearly the lowest in the 1972 to 2014 period. In an absolute sense, the incidence of such elections was very low. Only 4.9 percent of people in districts with elections saw their election won by 5 percent or less. Similarly, more Americans lived in areas with uncontested elections than ever before in the time period studied: 36.7 percent. These low levels of competitiveness were especially noteworthy given that Republicans picked up so many chambers and seats in 2014.
State legislative primaries were often found to be won by wide margins or not contested at all. Those who would defend the lack of competition in general elections by pointing to primaries are incorrect.
The rate at which incumbents won re-election is also close to an all-time high. However, this does not have to do with incumbents deriving more advantages from holding office than before. It is because they are more likely to be in safe districts for their party. In contrast to the high incumbency re-election rate, the rate at which incumbents run for re-election has gone down over time.
Competitiveness by state
See also
- State legislative elections, 2014
- 2014 state legislative elections analyzed using a Competitiveness Index
- Impact of term limits on state legislative elections in 2014
- United States Congress elections, 2014
- Gubernatorial elections, 2014
Footnotes
- ↑ Abramowitz, Alan. 2013. The Polarized Public: Why American Government is so Dysfunctional. New York: Pearson-Longman.
- ↑ Jacobson, Gary C. 2015. “Barack Obama and the Nationalization of Electoral Politics in 2014.” Political Science Quarterly 130(Spring): forthcoming.
- ↑ Levendusky, Matthew. 2009. The Partisan Sort: How Liberals Became Democrats and Conservatives Became Republicans. Chicago: University of Chicago Press.
- ↑ Klarner, Carl, William Berry, Thomas Carsey, Malcolm Jewell, Richard Niemi, Lynda Powell, and James Snyder. State Legislative Election Returns (1967-2010). ICPSR34297-v1. Ann Arbor, MI: Inter-university Consortium for Political and Social Research [distributor], 2013-01-11. doi:10.3886/ICPSR34297.v1.
- ↑ Brunell, Thomas L. 2008. Redistricting and Representation: Why Competitive Elections are Bad for America. New York: Routlege.
Contact information
Media inquiries can be e-mailed to Kristen Mathews
Appendix A
Methodology
- Data on state legislative elections in this report are from the State Legislative Election Returns database (Klarner et al. 2013) and were supplemented by data gathered from state websites for the 2011 through 2014 elections. U.S. House election data was generously provided by Gary Jacobson. U.S. Senate and gubernatorial election data are from Congressional Quarterly’s “Voting and Elections Collection.”
Four states currently have state legislative elections in odd numbered years (Louisiana, Mississippi, New Jersey and Virginia), and one did until 1984 (Kentucky). All the graphs in this report exclude data from odd-year state legislative elections to make the graphs easier to examine and to allow explicit comparisons between the data and attributes of specific election years. However, grouping them in with the even years generates trends that are virtually identical.
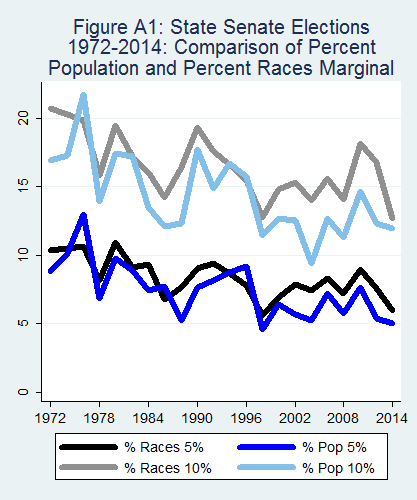
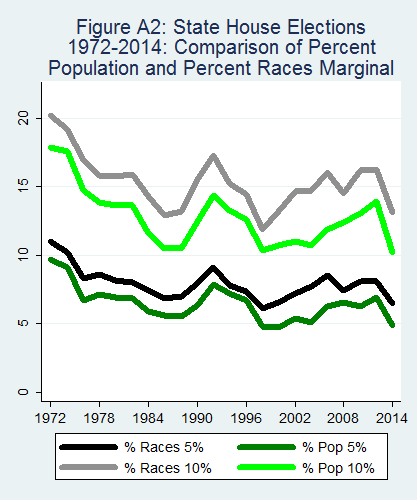
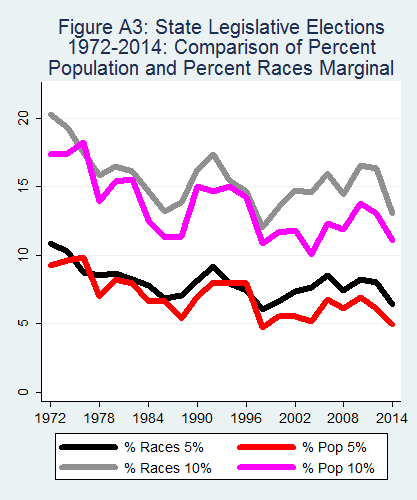
When computing averages about elections, the data are weighted by the population of the area they are conducted in. To give an example, imagine a country with two states, each with a state legislature with two state legislators. One state has 8 million people, while the other has 2 million. If the only district that was competitive was in the state with 2 million people, the percentage of people living in a competitive district would be 10 percent. If instead we measured the percentage of elections that were competitive, it would be 25 percent (i.e., 1/4). To avoid awkward repetition, the main body of text sometimes refers to the percentage of the country in a particular type of election, which is somewhat inaccurate. The statistics in question always refer to people living in districts with a competitive election (of the various types discussed in the main body of the text) as a percent of all people living in districts having elections that year. The weighting by population is fairly consequential for the findings, although not for conclusions about trends. Figures A1, A2 and A3 compare the weighted with the unweighted data for state senates, state houses and the legislature as a whole, respectively. All three figures indicate that the unweighted data show a higher level of competitiveness in comparison to the weighted data. This is especially the case for recent years and for state houses.
A second way the data are weighted that was not commented on in the main body of text is that it also considers the length of terms of the offices involved. This is because it is arguably inappropriate to assume that an election to a two-year term that was uncompetitive is as consequential as an election to a four-year term. This also prevents some states from having twice the weight of others. For example, all legislative terms in Maine are two years long, while all legislative terms in Maryland are four years long, meaning Maine’s impact on aggregate figures relative to Maryland's would double if not weighted by term length. However, figures generated that do not include this aspect of weighting are virtually identical to those with this form of weighting.
When marginal races were tracked over time, U.S. Senate and U.S. House elections were examined as a percentage of all races, while gubernatorial and presidential trends were tracked in terms of the percentage of the country living in states with different levels of marginality. It was appropriate to treat these differently. Each U.S. senator has equal power, regardless of the size of the state he or she is from. A governor of a populous state has more power than one from a less populous state, and a state with more electoral votes is more important in determining the outcome of a presidential election than a less populous state with fewer electoral votes.
A more technically correct way of describing the uncontested elections tracked in the graphs is that it is the seats that are guaranteed for one party or the other divided by the number of seats up for election (and then multiplied by 100). The distinction from what was written in the text above only matters for state legislative elections in free-for-all, multi-member districts. For example, if two Democratic candidates and one Republican candidate run in a district with two seats (such as for the Arizona State House), the Democrats are assured of one seat. So this election would contribute “1” to the numerator of the fraction, and “2” to the denominator of the fraction.
A more technically correct way of describing the incumbency “run rate” examined above is that it is the number of incumbents who are running for re-election, divided by the number of seats that are up for election (and then weighted by population, of course). This only matters when there are more incumbents running in an election than there are seats to be won. This sometimes occurs after redistricting, for example, when a Democratic incumbent and a Republican incumbent are drawn into the same single-member district. A case can be made that situations where two incumbents face each other in a single-member district because of redistricting should be distinguished from those where an incumbent runs with no other incumbents in the election, but this was not done for the sake of simplicity. The trend lines created in all graphs were fitted by STATA’s “lowess” command.
Appendix B
State Pages
- Information for each state’s competitiveness is provided on state pages.
Almost all elections in the 1972 to 2014 period are contained in the State Legislative Election Returns dataset, but a very small portion are missing. The biggest omission is Vermont’s elections up until 1986. Aside from that, the percentage of elections with missing data for a particular state and a particular year is noted in the state pages. The variable "% Unusable" indicates the percentage of elections that are missing data; this lack of data prevents an assessment as to whether the election was marginal or not. The variable "% Unusable other" indicates the percentage of elections that are missing data, thereby preventing an assessment as to whether an election was uncontested, whether an incumbent lost re-election, or whether an incumbent was running.
For U.S. Senate, presidential and gubernatorial elections, “margin of victory” is reported on the main pages instead of the percentage of states that are marginal. Sometimes two U.S. Senate elections are held simultaneously in a state, and that second one is reported as well.


