Texas' 27th Congressional District election, 2024
All U.S. House districts, including the 27th Congressional District of Texas, held elections in 2024. The general election was November 5, 2024. The primary was March 5, 2024, and a primary runoff was May 28, 2024. The filing deadline was December 11, 2023.
The outcome of this race affected the partisan balance of the U.S. House of Representatives in the 119th Congress. All 435 House districts were up for election.
At the time of the election, Republicans held a 220-212 majority with three vacancies.[1] As a result of the election, Republicans retained control of the U.S. House, winning 220 seats to Democrats' 215.[2] To read more about the 2024 U.S. House elections, click here.
In the 2022 election in this district, the Republican candidate won 64.4%-35.6%. Daily Kos calculated what the results of the 2020 presidential election in this district would have been following redistricting. Donald Trump (R) would have defeated Joe Biden (D) 60.6%-38.1%.[3]
For more information about the primaries in this election, click on the links below:
- Texas' 27th Congressional District election, 2024 (March 5 Democratic primary)
- Texas' 27th Congressional District election, 2024 (March 5 Republican primary)
Candidates and election results
General election
General election for U.S. House Texas District 27
Incumbent Michael Cloud defeated Tanya Lloyd in the general election for U.S. House Texas District 27 on November 5, 2024.
Candidate | % | Votes | ||
| ✔ |  | Michael Cloud (R) | 66.0 | 183,980 |
 | Tanya Lloyd (D) | 34.0 | 94,596 | |
| Total votes: 278,576 | |||
| If you are a candidate and would like to tell readers and voters more about why they should vote for you, complete the Ballotpedia Candidate Connection Survey. | ||||
Do you want a spreadsheet of this type of data? Contact our sales team. | ||||
Withdrawn or disqualified candidates
- Eric Scott Loyd (Independent)
Democratic primary election
Democratic primary for U.S. House Texas District 27
Tanya Lloyd defeated Anthony Tristan in the Democratic primary for U.S. House Texas District 27 on March 5, 2024.
Candidate | % | Votes | ||
| ✔ | | Tanya Lloyd | 53.3 | 10,305 |
 | Anthony Tristan | 46.7 | 9,013 | |
| Total votes: 19,318 | |||
| If you are a candidate and would like to tell readers and voters more about why they should vote for you, complete the Ballotpedia Candidate Connection Survey. | ||||
Do you want a spreadsheet of this type of data? Contact our sales team. | ||||
Republican primary election
Republican primary for U.S. House Texas District 27
Incumbent Michael Cloud defeated Scott Mandel, Luis Espindola, and Chris Mapp in the Republican primary for U.S. House Texas District 27 on March 5, 2024.
Candidate | % | Votes | ||
| ✔ | | Michael Cloud | 74.6 | 53,304 |
 | Scott Mandel | 15.1 | 10,791 | |
 | Luis Espindola | 5.4 | 3,838 | |
 | Chris Mapp | 5.0 | 3,553 | |
| Total votes: 71,486 | |||
| If you are a candidate and would like to tell readers and voters more about why they should vote for you, complete the Ballotpedia Candidate Connection Survey. | ||||
Do you want a spreadsheet of this type of data? Contact our sales team. | ||||
Ballotpedia's Candidate Connection survey responses
Ballotpedia asks all federal, state, and local candidates to complete a survey and share what motivates them on political and personal levels. The section below shows responses from candidates in this race who completed Ballotpedia's Candidate Connection survey. Candidates are asked three required questions for this survey, but they may answer additional optional questions as well.
![]()
Survey responses from candidates in this race
Click on a candidate's name to visit their Ballotpedia page.
Note: Ballotpedia reserves the right to edit Candidate Connection survey responses. Any edits made by Ballotpedia will be clearly marked with [brackets] for the public. If the candidate disagrees with an edit, he or she may request the full removal of the survey response from Ballotpedia.org. Ballotpedia does not edit or correct typographical errors unless the candidate's campaign requests it.
| Collapse all
Tanya Lloyd (D)
Standing up for reproductive rights: ensuring the government doesn't get between women and their doctors.
No rural community left behind: strengthening local economies and our crumbling rural healthcare infrastructure.
Tanya Lloyd (D)
Candidate profiles
This section includes candidate profiles that may be created in one of two ways: either the candidate completed Ballotpedia's Candidate Connection survey, or Ballotpedia staff may compile a profile based on campaign websites, advertisements, and public statements after identifying the candidate as noteworthy. For more on how we select candidates to include, click here.

Party: Democratic Party
Incumbent: No
Submitted Biography: "I am not a politician, I’m a first grade public school teacher. As a life-long Republican voter, I am running as a Democrat for Congress because I am deeply concerned about the future of this country: the extreme attacks on our public education system, on women's healthcare, and the political division threatening our democracy. Learn More At: www.TanyaForTX27.com"
![]()
![]()
This information was current as of the candidate's run for U.S. House Texas District 27 in 2024.
Voting information
- See also: Voting in Texas
Campaign finance
| Name | Party | Receipts* | Disbursements** | Cash on hand | Date |
|---|---|---|---|---|---|
| Michael Cloud | Republican Party | $798,397 | $943,006 | $136,877 | As of December 31, 2024 |
| Tanya Lloyd | Democratic Party | $60,032 | $59,845 | $187 | As of December 31, 2024 |
| Anthony Tristan | Democratic Party | $4,786 | $4,797 | $0 | As of December 31, 2024 |
| Luis Espindola | Republican Party | $20,784 | $20,784 | $3,757 | As of March 15, 2024 |
| Scott Mandel | Republican Party | $15,000 | $52,876 | $135 | As of September 30, 2024 |
| Chris Mapp | Republican Party | $0 | $0 | $71 | As of June 30, 2023 |
|
Source: Federal Elections Commission, "Campaign finance data," 2024. This product uses the openFEC API but is not endorsed or certified by the Federal Election Commission (FEC).
* According to the FEC, "Receipts are anything of value (money, goods, services or property) received by a political committee." |
|||||
General election race ratings
- See also: Race rating definitions and methods
Ballotpedia provides race ratings from four outlets: The Cook Political Report, Inside Elections, Sabato's Crystal Ball, and DDHQ/The Hill. Each race rating indicates if one party is perceived to have an advantage in the race and, if so, the degree of advantage:
- Safe and Solid ratings indicate that one party has a clear edge and the race is not competitive.
- Likely ratings indicate that one party has a clear edge, but an upset is possible.
- Lean ratings indicate that one party has a small edge, but the race is competitive.[4]
- Toss-up ratings indicate that neither party has an advantage.
Race ratings are informed by a number of factors, including polling, candidate quality, and election result history in the race's district or state.[5][6][7]
| Race ratings: Texas' 27th Congressional District election, 2024 | |||||||||
|---|---|---|---|---|---|---|---|---|---|
| Race tracker | Race ratings | ||||||||
| November 5, 2024 | October 29, 2024 | October 22, 2024 | October 15, 2024 | ||||||
| The Cook Political Report with Amy Walter | Solid Republican | Solid Republican | Solid Republican | Solid Republican | |||||
| Decision Desk HQ and The Hill | Safe Republican | Safe Republican | Safe Republican | Safe Republican | |||||
| Inside Elections with Nathan L. Gonzales | Solid Republican | Solid Republican | Solid Republican | Solid Republican | |||||
| Larry J. Sabato's Crystal Ball | Safe Republican | Safe Republican | Safe Republican | Safe Republican | |||||
| Note: Ballotpedia reviews external race ratings every week throughout the election season and posts weekly updates even if the media outlets have not revised their ratings during that week. | |||||||||
Ballot access
The table below details filing requirements for U.S. House candidates in Texas in the 2024 election cycle. For additional information on candidate ballot access requirements in Texas, click here.
| Filing requirements for U.S. House candidates, 2024 | ||||||
|---|---|---|---|---|---|---|
| State | Office | Party | Signatures required | Filing fee | Filing deadline | Source |
| Texas | U.S. House | Democratic or Republican | 2% of votes cast for governor in the district in the last election, or 500, whichever is less | $3,125.00 | 12/11/2023 | Source |
| Texas | U.S. House | Unaffiliated | 5% of all votes cast for governor in the district in the last election, or 500, whichever is less | N/A | 12/11/2023 | Source |
District analysis
Click the tabs below to view information about voter composition, past elections, and demographics in both the district and the state.
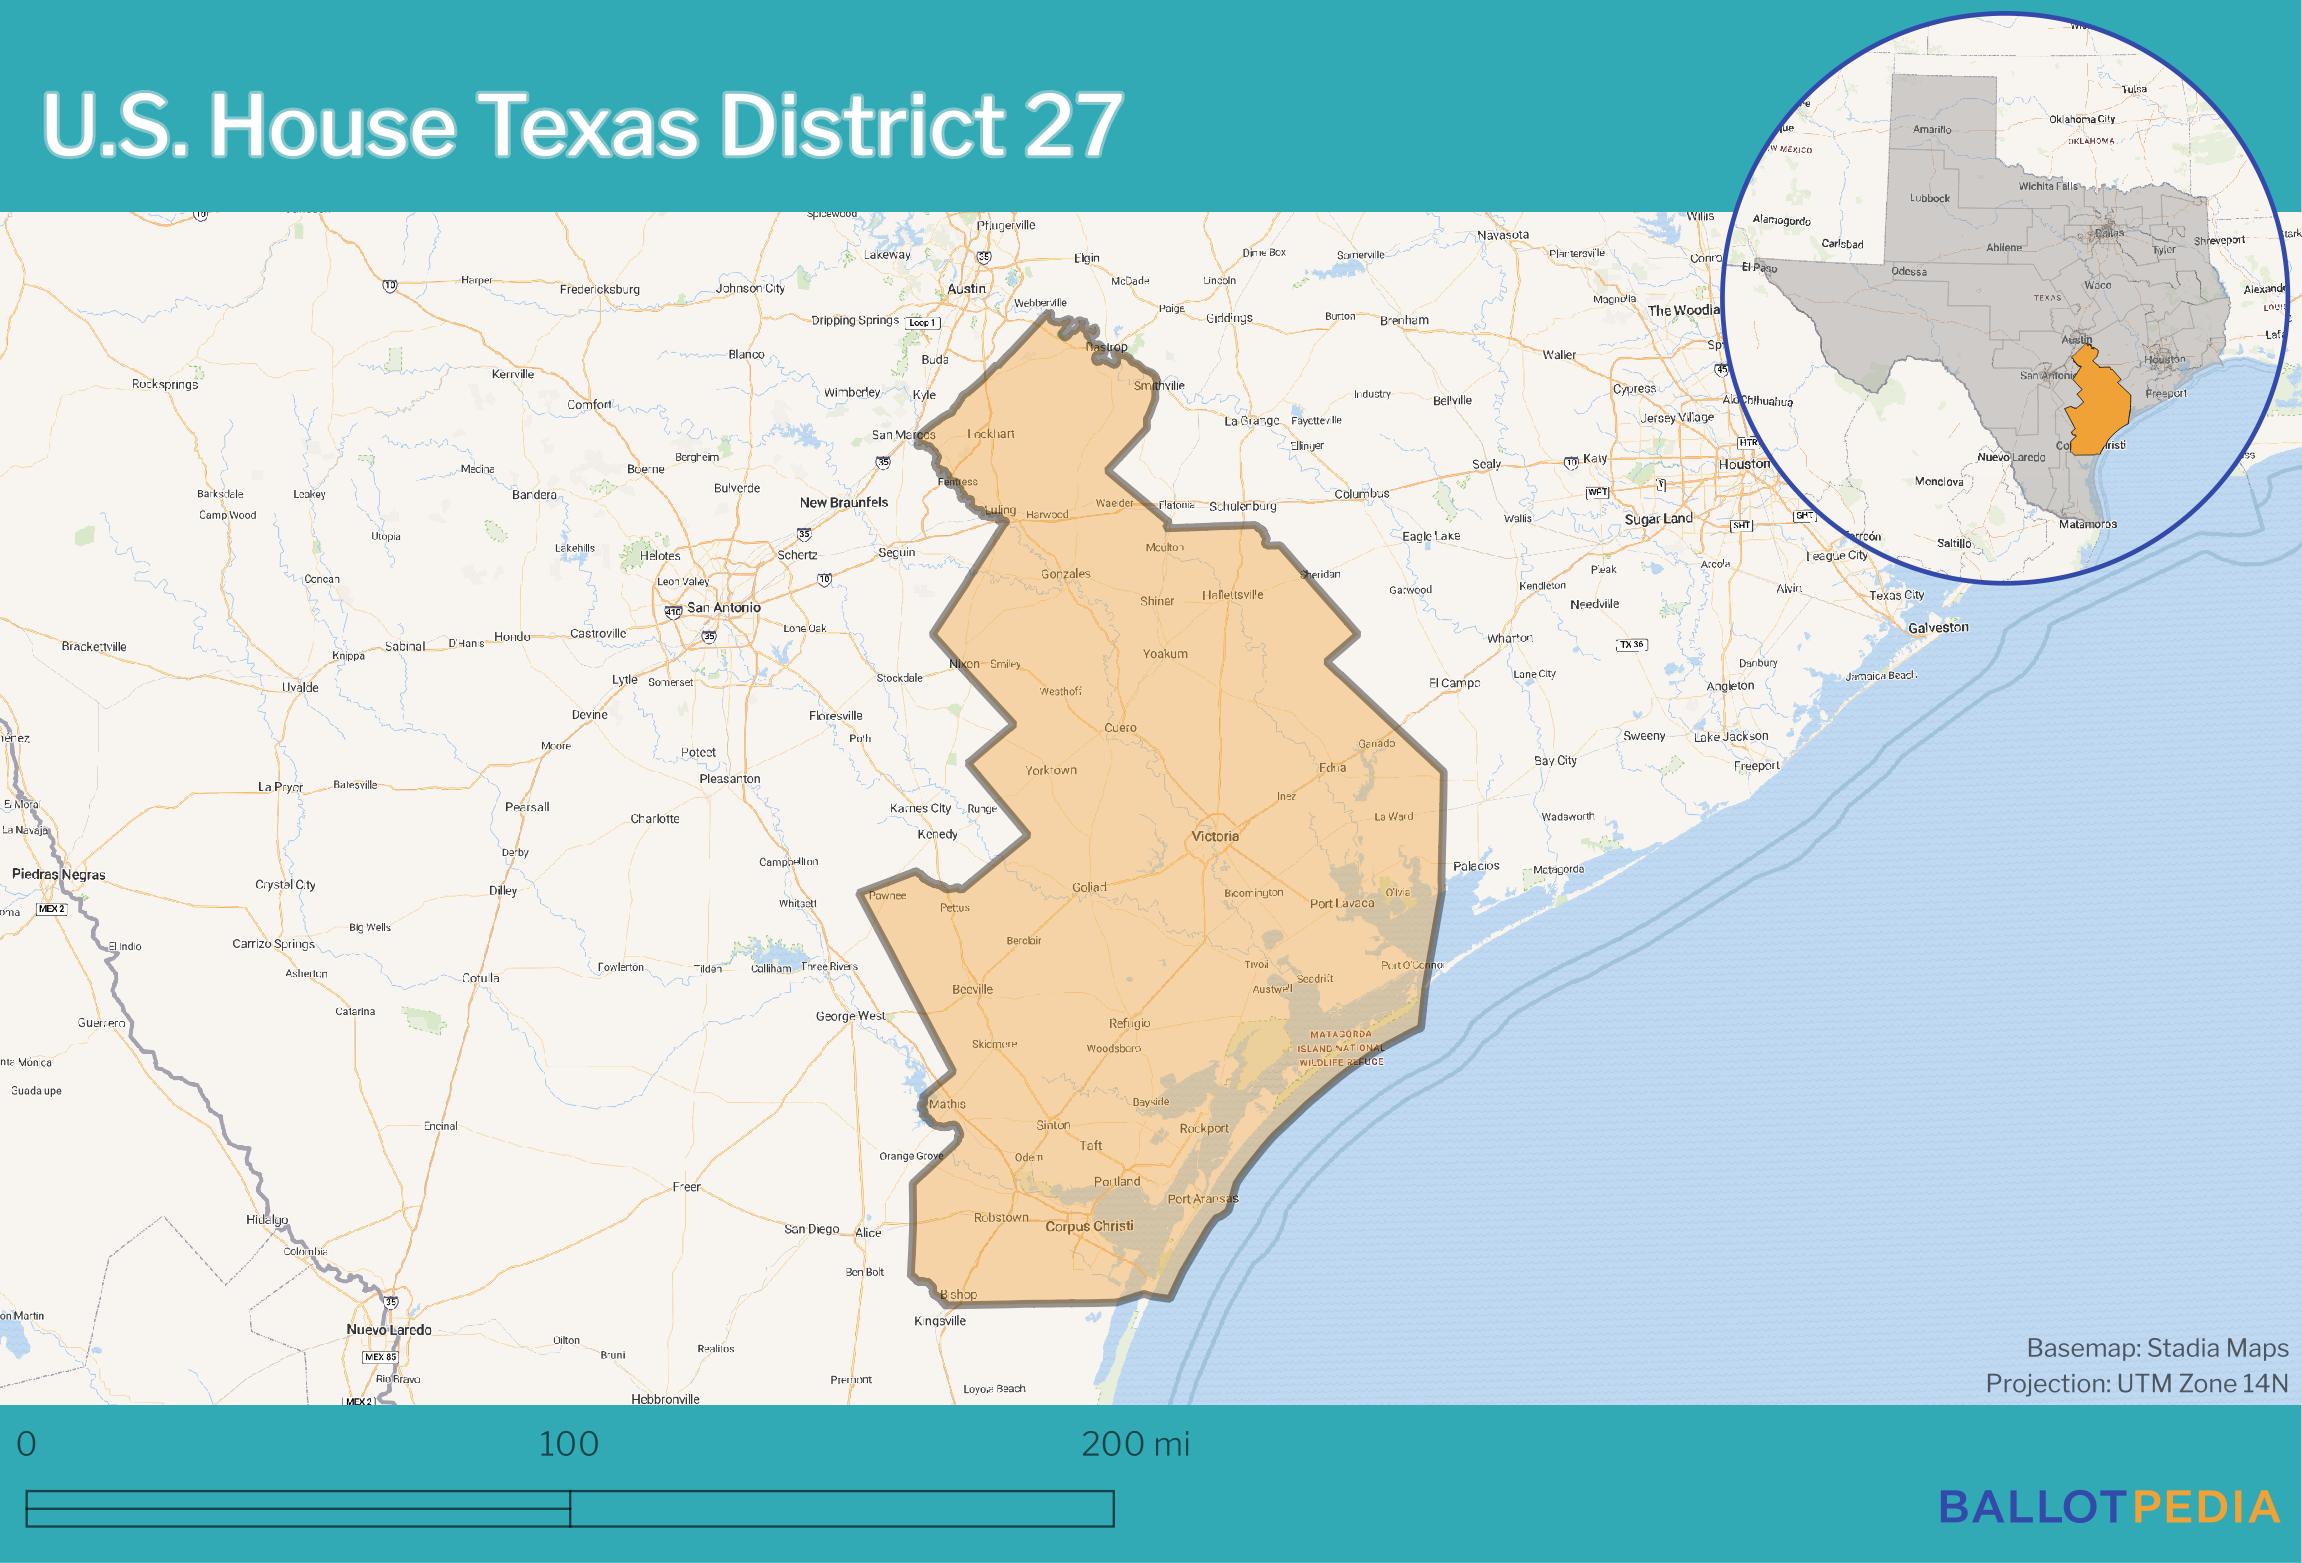
- District map - A map of the district in place for the election.
- Competitiveness - Information about the competitiveness of 2024 U.S. House elections in the state.
- Presidential elections - Information about presidential elections in the district and the state.
- State party control - The partisan makeup of the state's congressional delegation and state government.
Below was the map in use at the time of the election. Click the map below to enlarge it.
This section contains data on U.S. House primary election competitiveness in Texas.
| Texas U.S. House competitiveness, 2014-2024 | ||||||||||||||
|---|---|---|---|---|---|---|---|---|---|---|---|---|---|---|
| Year | Districts/ offices |
Seats | Open seats | Candidates | Possible primaries | Contested Democratic primaries | Contested Republican primaries | % of contested primaries | Incumbents in contested primaries | % of incumbents in contested primaries | ||||
| 2024 | 38 | 38 | 3 | 160 | 76 | 16 | 23 | 51.3% | 19 | 54.3% | ||||
| 2022 | 38 | 38 | 6 | 222 | 76 | 17 | 27 | 57.9% | 19 | 59.4% | ||||
| 2020 | 36 | 36 | 6 | 231 | 72 | 24 | 26 | 69.4% | 18 | 60.0% | ||||
| 2018 | 36 | 36 | 8 | 212 | 72 | 25 | 21 | 63.9% | 15 | 53.6% | ||||
| 2016 | 36 | 36 | 2 | 127 | 72 | 13 | 20 | 45.8% | 19 | 55.9% | ||||
| 2014 | 36 | 36 | 1 | 100 | 72 | 6 | 13 | 26.4% | 12 | 34.3% | ||||
Post-filing deadline analysis
The following analysis covers all U.S. House districts up for election in Texas in 2024. Information below was calculated on 1/29/2024, and may differ from information shown in the table above due to candidate replacements and withdrawals after that time.
In 2024, 164 candidates filed to run for Texas’ 38 U.S. House districts, including 63 Democrats and 101 Republicans. That was 4.3 candidates per district, the lowest number since 2016, when 3.5 candidates ran.
In 2022, the first election after the number of congressional districts in Texas increased from 36 to 38, 5.8 candidates ran per district. In 2020, 6.4 candidates ran, and 5.8 candidates ran in 2018.
The 164 candidates who ran in 2024 were also the fewest total number to run since 2016, when 127 candidates ran. One hundred candidates ran for Texas’ then-36 districts in 2014, the fewest in the decade, while 231 ran in 2020, the decade-high.
Three seats were open. That was the fewest since 2016, when two seats were open. Six seats were open in 2022 and 2020, and eight were in 2018—the decade-high.
Reps. Kay Granger (R-12th) and Michael Burgess (R-26th) retired from public office. Rep. Colin Allred (D-32nd) didn't seek re-election in order to run for the U.S. Senate. Fourteen candidates—10 Democrats and 4 Republicans—ran for the open 32nd district, the most candidates who ran for a seat in 2024.
Thirty-nine primaries—16 Democratic and 23 Republican—were contested this year. That was the fewest since 2016, when 33 were contested. There were 44 contested primaries in 2022, 50 in 2020, and 46 in 2018.
Nineteen incumbents—six Democrats and thirteen Republicans—faced primary challengers this year. That was the same number as 2022, and one more than in 2020.
Three districts—the 9th, the 20th, and the 30th—were guaranteed to Democrats because no Republicans filed to run. Five were guaranteed to Republicans because no Democrats filed to run—the 1st, the 11th, the 13th, the 19th, and the 25th.
Partisan Voter Index
Heading into the 2024 elections, based on results from the 2020 and 2016 presidential elections, the Cook Partisan Voter Index for this district was R+13. This meant that in those two presidential elections, this district's results were 13 percentage points more Republican than the national average. This made Texas' 27th the 104th most Republican district nationally.[8]
2020 presidential election results
The table below shows what the vote in the 2020 presidential election would have been in this district. The presidential election data was compiled by Daily Kos.
| 2020 presidential results in Texas' 27th based on 2024 district lines | ||||
|---|---|---|---|---|
| Joe Biden |
Donald Trump | |||
| 38.1% | 60.6% | |||
Inside Elections Baselines
- See also: Inside Elections
Inside Elections' Baseline is a figure that analyzes all federal and statewide election results from the district over the past four election cycles. The results are combined in an index estimating the strength of a typical Democratic or Republican candidate in the congressional district.[9] The table below displays the Baseline data for this district.
| Inside Elections Baseline for 2024 | ||||
|---|---|---|---|---|
| Democratic Baseline |
Republican Baseline |
Difference | ||
| 37.1 | 60.8 | R+23.7 | ||
Presidential voting history
- See also: Presidential election in Texas, 2020
Texas presidential election results (1900-2020)
- 16 Democratic wins
- 15 Republican wins
| Year | 1900 | 1904 | 1908 | 1912 | 1916 | 1920 | 1924 | 1928 | 1932 | 1936 | 1940 | 1944 | 1948 | 1952 | 1956 | 1960 | 1964 | 1968 | 1972 | 1976 | 1980 | 1984 | 1988 | 1992 | 1996 | 2000 | 2004 | 2008 | 2012 | 2016 | 2020 |
|---|---|---|---|---|---|---|---|---|---|---|---|---|---|---|---|---|---|---|---|---|---|---|---|---|---|---|---|---|---|---|---|
| Winning Party | D | D | D | D | D | D | D | R | D | D | D | D | D | R | R | D | D | D | R | D | R | R | R | R | R | R | R | R | R | R | R |
- See also: Party control of Texas state government
Congressional delegation
The table below displays the partisan composition of Texas' congressional delegation as of May 2024.
| Congressional Partisan Breakdown from Texas | |||
|---|---|---|---|
| Party | U.S. Senate | U.S. House | Total |
| Democratic | 0 | 13 | 13 |
| Republican | 2 | 25 | 27 |
| Independent | 0 | 0 | 0 |
| Vacancies | 0 | 0 | 0 |
| Total | 2 | 38 | 40 |
State executive
The table below displays the officeholders in Texas' top four state executive offices as of May 2024.
| State executive officials in Texas, May 2024 | |
|---|---|
| Office | Officeholder |
| Governor | |
| Lieutenant Governor | |
| Secretary of State | |
| Attorney General | |
State legislature
Texas State Senate
| Party | As of February 2024 | |
|---|---|---|
| Democratic Party | 11 | |
| Republican Party | 19 | |
| Other | 0 | |
| Vacancies | 1 | |
| Total | 31 | |
Texas House of Representatives
| Party | As of February 2024 | |
|---|---|---|
| Democratic Party | 64 | |
| Republican Party | 86 | |
| Other | 0 | |
| Vacancies | 0 | |
| Total | 150 | |
Trifecta control
The table below shows the state's trifecta status from 1992 until the 2024 election.
Texas Party Control: 1992-2024
Three years of Democratic trifectas • Twenty-two years of Republican trifectas
Scroll left and right on the table below to view more years.
| Year | 92 | 93 | 94 | 95 | 96 | 97 | 98 | 99 | 00 | 01 | 02 | 03 | 04 | 05 | 06 | 07 | 08 | 09 | 10 | 11 | 12 | 13 | 14 | 15 | 16 | 17 | 18 | 19 | 20 | 21 | 22 | 23 | 24 |
|---|---|---|---|---|---|---|---|---|---|---|---|---|---|---|---|---|---|---|---|---|---|---|---|---|---|---|---|---|---|---|---|---|---|
| Governor | D | D | D | R | R | R | R | R | R | R | R | R | R | R | R | R | R | R | R | R | R | R | R | R | R | R | R | R | R | R | R | R | R |
| Senate | D | D | D | D | D | R | R | R | R | R | R | R | R | R | R | R | R | R | R | R | R | R | R | R | R | R | R | R | R | R | R | R | R |
| House | D | D | D | D | D | D | D | D | D | D | D | R | R | R | R | R | R | R | R | R | R | R | R | R | R | R | R | R | R | R | R | R | R |
District history
The section below details election results for this office in elections dating back to 2018.
General election
General election for U.S. House Texas District 27
Incumbent Michael Cloud (R) defeated Maclovio Perez Jr. (D) in the general election for U.S. House Texas District 27 on November 8, 2022.
Candidate | % | Votes | ||
| ✔ | | Michael Cloud (R) | 64.4 | 133,416 |
 | Maclovio Perez Jr. (D) | 35.6 | 73,611 | |
| Total votes: 207,027 | |||
| If you are a candidate and would like to tell readers and voters more about why they should vote for you, complete the Ballotpedia Candidate Connection Survey. | ||||
Do you want a spreadsheet of this type of data? Contact our sales team. | ||||
Democratic primary
Democratic primary for U.S. House Texas District 27
Maclovio Perez Jr. (D) defeated Anthony Tristan (D) and Victor Melgoza (D) in the Democratic primary for U.S. House Texas District 27 on March 1, 2022.
Candidate | % | Votes | ||
| ✔ | | Maclovio Perez Jr. | 59.1 | 13,044 |
| | Anthony Tristan | 26.0 | 5,733 | |
 | Victor Melgoza | 14.9 | 3,289 | |
| Total votes: 22,066 | |||
| If you are a candidate and would like to tell readers and voters more about why they should vote for you, complete the Ballotpedia Candidate Connection Survey. | ||||
Do you want a spreadsheet of this type of data? Contact our sales team. | ||||
Republican primary
Republican primary for U.S. House Texas District 27
Incumbent Michael Cloud (R) defeated A.J. Louderback (R), Chris Mapp (R), Andrew Alvarez (R), and Eric Mireles (R) in the Republican primary for U.S. House Texas District 27 on March 1, 2022.
Candidate | % | Votes | ||
| ✔ | | Michael Cloud | 72.5 | 45,741 |
 | A.J. Louderback | 12.2 | 7,704 | |
| | Chris Mapp | 7.2 | 4,542 | |
 | Andrew Alvarez | 4.2 | 2,648 | |
 | Eric Mireles | 3.9 | 2,478 | |
| Total votes: 63,113 | |||
| If you are a candidate and would like to tell readers and voters more about why they should vote for you, complete the Ballotpedia Candidate Connection Survey. | ||||
Do you want a spreadsheet of this type of data? Contact our sales team. | ||||
General election
General election for U.S. House Texas District 27
Incumbent Michael Cloud (R) defeated Ricardo De La Fuente (D) and Phil Gray (L) in the general election for U.S. House Texas District 27 on November 3, 2020.
Candidate | % | Votes | ||
| ✔ | | Michael Cloud (R) | 63.1 | 172,305 |
 | Ricardo De La Fuente (D) | 34.9 | 95,466 | |
 | Phil Gray (L) | 2.0 | 5,482 | |
| Total votes: 273,253 | |||
| If you are a candidate and would like to tell readers and voters more about why they should vote for you, complete the Ballotpedia Candidate Connection Survey. | ||||
Do you want a spreadsheet of this type of data? Contact our sales team. | ||||
Democratic primary
Democratic primary for U.S. House Texas District 27
Ricardo De La Fuente (D) defeated Charlie Jackson (D) in the Democratic primary for U.S. House Texas District 27 on March 3, 2020.
Candidate | % | Votes | ||
| ✔ | | Ricardo De La Fuente | 61.4 | 20,767 |
 | Charlie Jackson | 38.6 | 13,030 | |
| Total votes: 33,797 | |||
| If you are a candidate and would like to tell readers and voters more about why they should vote for you, complete the Ballotpedia Candidate Connection Survey. | ||||
Do you want a spreadsheet of this type of data? Contact our sales team. | ||||
Republican primary
Republican primary for U.S. House Texas District 27
Incumbent Michael Cloud (R) advanced from the Republican primary for U.S. House Texas District 27 on March 3, 2020.
Candidate | % | Votes | ||
| ✔ | | Michael Cloud | 100.0 | 60,945 |
| Total votes: 60,945 | |||
| If you are a candidate and would like to tell readers and voters more about why they should vote for you, complete the Ballotpedia Candidate Connection Survey. | ||||
Do you want a spreadsheet of this type of data? Contact our sales team. | ||||
Withdrawn or disqualified candidates
- Michael Lawrence (R)
Libertarian Party convention
Libertarian convention for U.S. House Texas District 27
Phil Gray (L) advanced from the Libertarian Party convention for U.S. House Texas District 27 on March 21, 2020.
Candidate | ||
| ✔ | | Phil Gray |
| ||||
| If you are a candidate and would like to tell readers and voters more about why they should vote for you, complete the Ballotpedia Candidate Connection Survey. | ||||
Do you want a spreadsheet of this type of data? Contact our sales team. | ||||
Regular election
General election
General election for U.S. House Texas District 27
Incumbent Michael Cloud (R) defeated Eric Holguin (D), James Duerr (Independent), and Daniel Tinus (L) in the general election for U.S. House Texas District 27 on November 6, 2018.
Candidate | % | Votes | ||
| ✔ | | Michael Cloud (R) | 60.3 | 125,118 |
 | Eric Holguin (D) | 36.6 | 75,929 | |
 | James Duerr (Independent) | 2.1 | 4,274 | |
 | Daniel Tinus (L) | 1.0 | 2,100 | |
| Total votes: 207,4210 | |||
| If you are a candidate and would like to tell readers and voters more about why they should vote for you, complete the Ballotpedia Candidate Connection Survey. | ||||
Do you want a spreadsheet of this type of data? Contact our sales team. | ||||
Democratic primary runoff
Democratic primary runoff for U.S. House Texas District 27
Eric Holguin (D) defeated Raul Barrera (D) in the Democratic primary runoff for U.S. House Texas District 27 on May 22, 2018.
Candidate | % | Votes | ||
| ✔ | | Eric Holguin | 62.0 | 6,376 |
 | Raul Barrera | 38.0 | 3,903 | |
| Total votes: 10,279 | |||
| If you are a candidate and would like to tell readers and voters more about why they should vote for you, complete the Ballotpedia Candidate Connection Survey. | ||||
Do you want a spreadsheet of this type of data? Contact our sales team. | ||||
Republican primary runoff
Republican primary runoff for U.S. House Texas District 27
Incumbent Michael Cloud (R) defeated Bech Bruun (R) in the Republican primary runoff for U.S. House Texas District 27 on May 22, 2018.
Candidate | % | Votes | ||
| ✔ | | Michael Cloud | 61.1 | 15,041 |
 | Bech Bruun | 38.9 | 9,565 | |
| Total votes: 24,606 | |||
| If you are a candidate and would like to tell readers and voters more about why they should vote for you, complete the Ballotpedia Candidate Connection Survey. | ||||
Do you want a spreadsheet of this type of data? Contact our sales team. | ||||
Democratic primary
Democratic primary for U.S. House Texas District 27
Raul Barrera (D) and Eric Holguin (D) advanced to a runoff. They defeated Vanessa Edwards Foster (D) and Ronnie McDonald (D) in the Democratic primary for U.S. House Texas District 27 on March 6, 2018.
Candidate | % | Votes | ||
| ✔ | | Raul Barrera | 41.2 | 8,733 |
| ✔ | | Eric Holguin | 23.3 | 4,939 |
 | Vanessa Edwards Foster | 19.1 | 4,041 | |
 | Ronnie McDonald | 16.4 | 3,474 | |
| Total votes: 21,187 | |||
| If you are a candidate and would like to tell readers and voters more about why they should vote for you, complete the Ballotpedia Candidate Connection Survey. | ||||
Do you want a spreadsheet of this type of data? Contact our sales team. | ||||
Republican primary
Republican primary for U.S. House Texas District 27
The following candidates ran in the Republican primary for U.S. House Texas District 27 on March 6, 2018.
Candidate | % | Votes | ||
| ✔ | | Bech Bruun | 36.1 | 15,919 |
| ✔ | | Michael Cloud | 33.8 | 14,920 |
| | Chris Mapp | 12.1 | 5,356 | |
 | Jerry Hall | 8.3 | 3,649 | |
| John Grunwald | 6.9 | 3,027 | ||
 | Eddie Gassman | 2.8 | 1,237 | |

| Total votes: 44,108 | |||
| If you are a candidate and would like to tell readers and voters more about why they should vote for you, complete the Ballotpedia Candidate Connection Survey. | ||||
Do you want a spreadsheet of this type of data? Contact our sales team. | ||||
Special election
General election
Special general election for U.S. House Texas District 27
The following candidates ran in the special general election for U.S. House Texas District 27 on June 30, 2018.
Candidate | % | Votes | ||
| ✔ | | Michael Cloud (R) | 54.8 | 19,872 |
| | Eric Holguin (D) | 32.0 | 11,599 | |
| | Raul Barrera (D) | 4.8 | 1,748 | |
| | Bech Bruun (R) | 4.3 | 1,571 | |
| Michael J. Westergren (D) | 2.4 | 858 | ||
 | Marty Perez (R) | 0.8 | 276 | |
| Judith Cutright (Independent) | 0.5 | 172 | ||
| | Daniel Tinus (L) | 0.4 | 144 | |
| Christopher Suprun (Independent) | 0.1 | 51 | ||
| Total votes: 36,291 | |||
| If you are a candidate and would like to tell readers and voters more about why they should vote for you, complete the Ballotpedia Candidate Connection Survey. | ||||
Do you want a spreadsheet of this type of data? Contact our sales team. | ||||
See also


External links
Footnotes
- ↑ A majority in the U.S. House when there are no vacancies is 218 seats.
- ↑ These figures include the seat of Rep. Matt Gaetz (R-Fla.), who resigned on Nov. 13, 2024, after winning re-election.
- ↑ Daily Kos, "Daily Kos Elections' 2020 presidential results by congressional district, for new and old districts," accessed September 15, 2022
- ↑ Inside Elections also uses Tilt ratings to indicate an even smaller advantage and greater competitiveness.
- ↑ Amee LaTour, "Email correspondence with Nathan Gonzalez," April 19, 2018
- ↑ Amee LaTour, "Email correspondence with Kyle Kondik," April 19, 2018
- ↑ Amee LaTour, "Email correspondence with Charlie Cook," April 22, 2018
- ↑ Cook Political Report, "The 2022 Cook Partisan Voting Index (Cook PVI℠)," accessed January 10, 2024
- ↑ Inside Elections, "Methodology: Inside Elections’ Baseline by Congressional District," December 8, 2023

